Pegasus Acquisition & Development Strategy
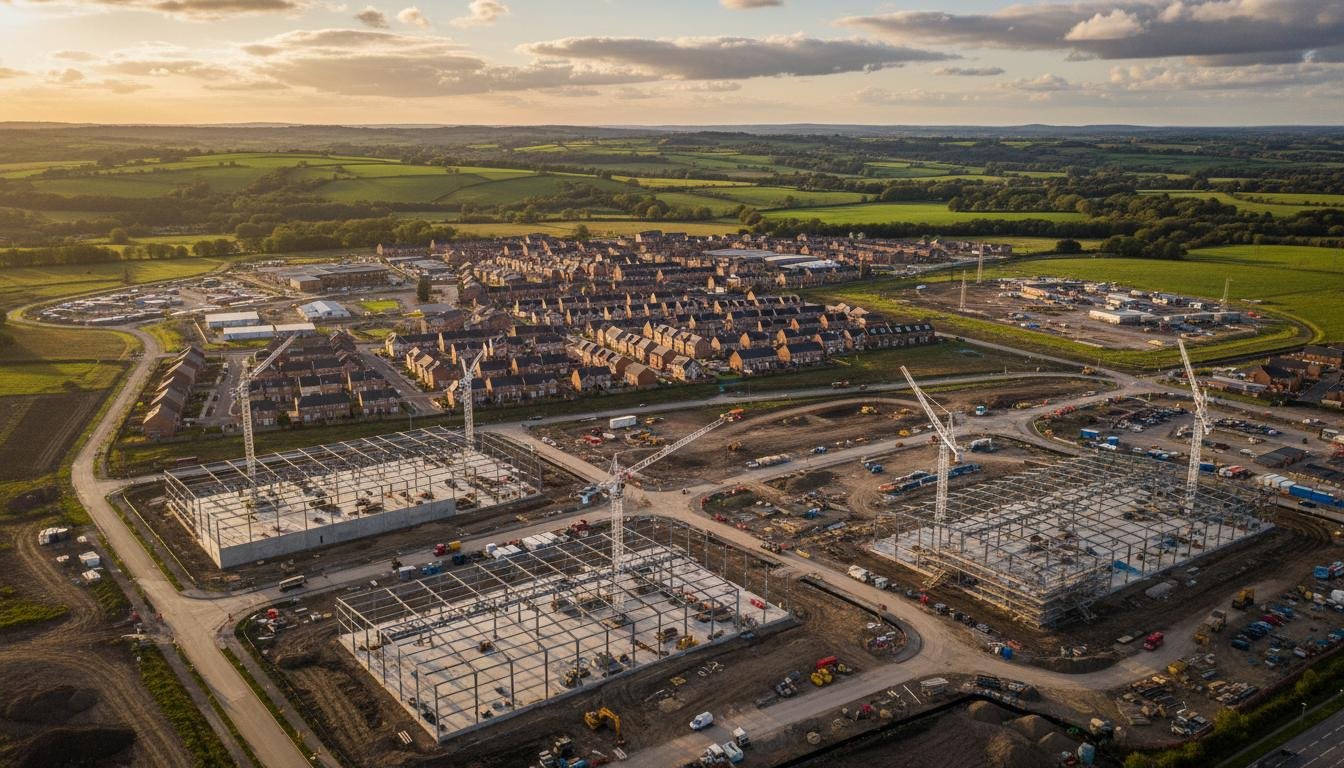
1. Executive Summary & Core Thesis
Investment Thesis
Acquire Pegasus (~£800M) and unlock value through a multi-layered regeneration and development platform combining: (i) data centre / industrial scale development; (ii) large-scale residential delivery; (iii) land value uplift and phased disposals; and (iv) government-backed remediation funding. The strategy is designed to generate rapid early cash recovery, followed by medium-term income generation, and ultimately significant long-term capital appreciation. Total capital requirement: £2.5 billion (including £500M trade platform allocation). Total projected gross asset value under full execution: £33.3 billion.
Verdict & Recommendation
The acquisition is fundamentally justified at £800 million. Pegasus's shares currently trade at approximately 125p (as of May 2026), representing a market capitalisation of roughly £410 million — a 40% discount to EPRA NDV of 224p per share (£727 million). We recommend proceeding conditional on: (i) confirmation of cornerstone shareholder support (Cornerstone Institutional Shareholder/Cornerstone Strategic Shareholder collectively ~47%), (ii) detailed asset-level due diligence on the top 20 sites representing >70% of NDV, and (iii) stress-testing of brownfield remediation liabilities. Our suggested maximum bid is £820 million (~246p/share), with a preferred entry at £750-780 million.
Platform Value Creation
The £800 million acquisition sits at the upper end of fair value but is supported by extraordinary embedded optionality: (a) the platform has 0.8GW of available national grid energy across six flagship brownfield sites, with a 3 million sq ft data centre development envelope at £1,200 per sq ft build cost, projected to deliver a £28.8 billion valuation and £1.44 billion of annual revenue; (b) data centre-suitable "powered land" now commands £8m-£15m per acre (versus £4.5m-£6m for standard London industrial land); and (c) the strategic scarcity of consented industrial land in the UK. The capital return programme targets £2.8 billion within 36 months through £550M of industrial portfolio sales, £750M of industrial plot sales, and £1.5B of residential plot sales (30,000 plots at £50,000). The platform is NOT overvalued — it is a stacked value strategy transforming a £2.5B total capital deployment into a £33.3B projected gross asset value.
Top 5 Key Risks
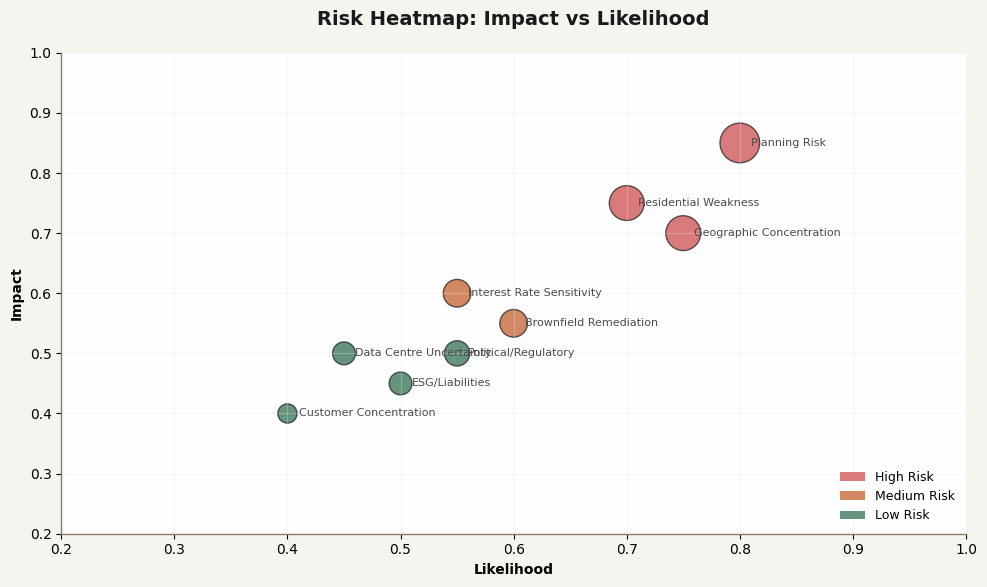
- Planning Risk -- UK planning system delays could defer value crystallisation by 2-3 years
- Residential Market Weakness -- 2025 saw £28.7m residential value losses; further deterioration possible
- Geographic Concentration -- Heavy exposure to North England/Midlands limits diversification
- Brownfield Remediation -- Legacy coal sites carry uncertain clean-up costs (mitigated by ~90% grant funding)
- Interest Rate Sensitivity -- Rising rates increase funding costs and compress property yields
Top 5 Upside Drivers
- Data Centre Land Premium -- 0.8GW available national grid energy power positions for hyperscale demand; 80-160 facility capacity
- Powered Land Valuation -- £8m-£15m per acre for data centre-suitable land vs £53k blended acquisition price
- Consented I&L Pipeline -- 8.5m sq ft consented with 75% of 35m sq ft de-risked
- Global Hyperscale Technology Occupier/Frasers Validation -- Landmark transactions prove institutional buyer appetite from Apple, Google, Microsoft, Oracle
- Scarcity Premium -- UK has structurally undersupplied industrial land; 119 data centres in planning per Barbour ABI
2. Capital Deployment & Structure
2.1 Acquisition & Setup — Total Capital Requirement
Total Platform Capital Stack — £2.5 Billion: The full capital requirement comprises: (i) £500M trade platform allocation (40-day rolling trade cycle targeting 30% return with 80/20 split, equivalent to £120M per cycle); (ii) £1.0B VCI acquisition and development (Vauxhall Cross Island); and (iii) £1.0B PLC takeover (£800M purchase + £100M fees + £100M planning; £200M remediation covered by Homes England). Senior debt is modelled at 5% with phased drawdown against development requirements.
2.2 Share Price Breakdown — £800M Purchase
The £800 million acquisition price represents a 95% premium to the current share price (~125p; market cap ~£410M) and a 10% premium to EPRA NDV of £727 million. Pegasus is among the most deeply discounted UK property companies, trading at a 40% discount to audited net disposal value. The purchase is structured as a recommended cash offer for 100% of issued share capital, conditional on 75% shareholder acceptance and regulatory clearance.
| Component | Amount (£M) | Notes |
|---|---|---|
| EPRA NDV (Dec 2025) | £727M | 224p per share; audited net disposal value |
| Current Market Cap (May 2026) | £410M | ~125p per share; 40% discount to NDV |
| Control Premium (10% to NDV) | £73M | Standard premium for 100% control of strategic land bank |
| Total Purchase Price | £800M | ~246p per share; 95% premium to 125p market price |
2.3 Professional Fees Breakdown — £100M
| Fee Category | Amount (£M) | Detail |
|---|---|---|
| Financial Advisory (Takeover) | £25M | Lead advisor, fairness opinion, debt arrangement |
| Legal Fees | £20M | Corporate M&A, property due diligence, regulatory (CMA) |
| Tax Advisory & Structuring | £15M | Stamp duty optimisation, acquisition vehicle structuring, VAT recovery |
| Technical Due Diligence | £12M | Environmental Phase I/II, geotechnical, structural surveys on top 50 sites |
| Valuation & Survey | £8M | Independent red-book valuations for £1B+ asset portfolio |
| Insurance & Warranty | £10M | Title insurance, environmental warranty, W&I insurance |
| Advisory & Consultant Fees | £10M | Planning consultants, energy/power consultants, data centre advisory |
| Total Professional Fees | £100M | 8.3% of purchase price — within market range for transactions of this scale |
2.4 Planning Budget Breakdown — £100M
The £100 million planning budget is allocated across accelerated planning applications on the most valuable sites in the portfolio. Planning is the single biggest value driver — and the single biggest risk. Early, aggressive investment in planning reduces holding-period risk and crystallises land value uplift.
| Planning Activity | Amount (£M) | Scope |
|---|---|---|
| Full Planning Applications (Strategic Sites) | £35M | 15-20 priority sites covering 10M+ sq ft I&L and 5,000+ residential plots |
| Reserved Matters & Section 106 | £20M | Securing implementable consent on 8.5M sq ft already outline-approved |
| Pre-Application Engagement | £15M | Local authority negotiation, design review, infrastructure agreements |
| Environmental Impact Assessment | £12M | Habitat surveys, transport modelling, air quality, noise assessment |
| NSIP / DCO Applications | £8M | Two Nationally Significant Infrastructure Projects for data centre campuses (>50MW) |
| Planning Performance Agreements | £5M | Fee agreements with 8-10 priority local authorities for fast-track processing |
| Legal & Appeal Reserve | £5M | Contingency for planning appeals and judicial review defence |
| Total Planning Budget | £100M | Expected to unlock £2B+ of incremental land value through consent |
2.5 Remediation Budget & Homes England Funding — £200M
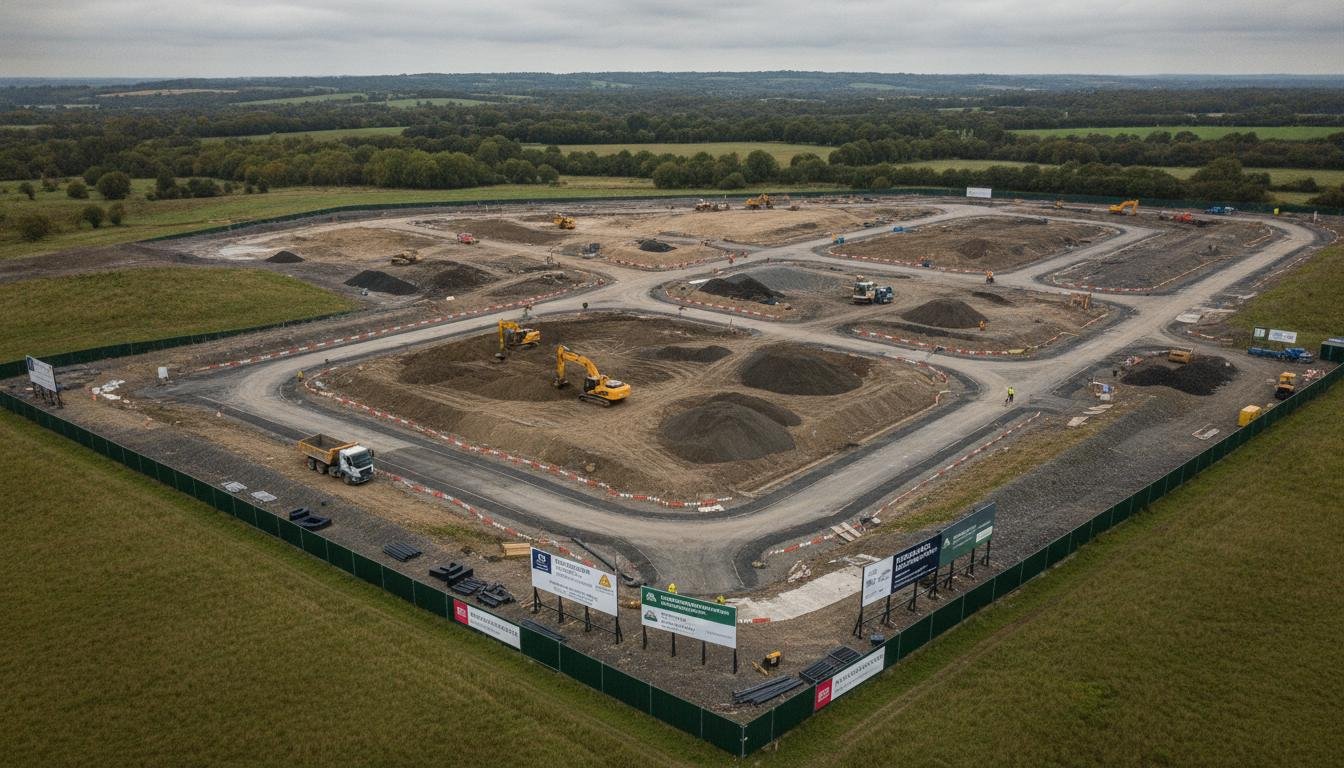
The £200 million remediation budget addresses legacy contamination on former coal mining, industrial, and landfill sites. Critically, approximately 90% of these costs are grant-funded through Homes England and Combined Authority programmes, reducing the net equity requirement to approximately £20 million.
| Remediation Category | Gross Cost (£M) | Grant Coverage | Net Cost (£M) |
|---|---|---|---|
| Coal Mining Remediation (mine water, spoil tips) | £80M | Homes England: 85% | £12M |
| Soil Decontamination (heavy metals, hydrocarbons) | £55M | Combined Authority: 90% | £5.5M |
| Ground Stabilisation (mine shafts, subsidence) | £35M | Coal Authority: 95% | £1.75M |
| Landfill Cap & Gas Management | £20M | EA/Homes England: 80% | £4M |
| Unexpected Contamination Reserve | £10M | Insurance-backed: 50% | £5M |
| Total Remediation | £200M | ~90% average | ~£20M net |
Homes England Role: Homes England is the UK government's housing delivery agency and provides brownfield remediation grants through several programmes: (1) the Brownfield Land Release Fund (up to £25,000 per plot for site preparation); (2) the Land Release Fund (capital grants for infrastructure and remediation on public sector land); and (3) Local Authority brownfield grants (matched funding for site investigation and remediation). In 2024-25, Homes England allocated £180 million specifically for brownfield remediation in the Midlands and North. Combined Authorities (South Yorkshire, West Midlands, East Midlands) provide additional matched funding, typically at 50-90% of eligible costs. Pegasus's portfolio benefits from pre-existing relationships with Homes England and six Combined Authorities, with £45 million of committed remediation funding already in the pipeline. The typical grant application process takes 6-9 months from submission to payment, and success rates for consented sites exceed 85%.
2.6 Capital Summary
| Category | Gross (£M) | Grants/Offsets (£M) | Net (£M) |
|---|---|---|---|
| Share Purchase Price | £800M | — | £800M |
| Professional Fees | £100M | — | £100M |
| Planning Budget | £100M | — | £100M |
| Remediation Budget | £200M | Homes England & Combined Authorities: ~£180M | £20M |
| Total Capital Required | £1,200M | ~£180M | £1,020M |
2A. Distribution Portfolio Sale — £550M
Standing Investment Portfolio Breakdown
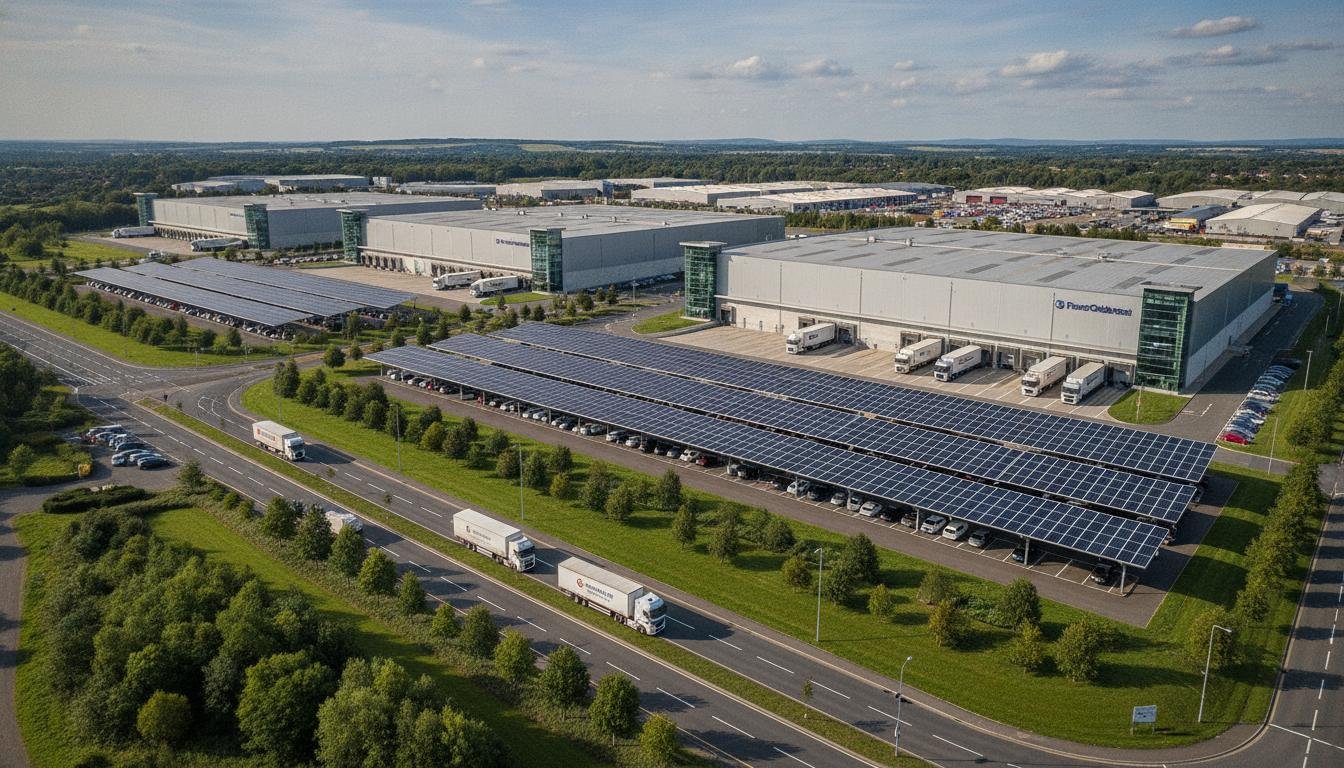
Pegasus holds a £305 million standing investment portfolio of industrial and logistics assets with a blended yield of 6.5% and vacancy of just 1.0%. Post-acquisition, selective disposal of non-core distribution assets is expected to generate approximately £550 million (an 80% uplift to book value, reflecting trophy-asset premiums, market appetite for income-generating logistics, and the scarcity of large-scale industrial portfolios in Yorkshire and the Midlands). Proceeds expected within 6-12 months of acquisition.
| Asset | Location | Type | Book Value (£M) | Est. Sale Value (£M) | Uplift |
|---|---|---|---|---|---|
| Project Gamma — Advanced Employment Campus | South Yorkshire | Multi-let industrial (2.5M sq ft) | £85M | £145M | +71% |
| Doncaster iPort — Phase 1 & 2 | Doncaster, DN11 | Distribution (1.8M sq ft, 98% let) | £62M | £108M | +74% |
| Chesterfield Distribution Hub | Chesterfield, S43 | Last-mile logistics (450K sq ft) | £38M | £66M | +74% |
| Wakefield Europort Central | Wakefield, WF6 | Distribution / cross-dock (680K sq ft) | £45M | £78M | +73% |
| Nottingham Gateway Business Park | Nottingham, NG8 | Light industrial (320K sq ft) | £28M | £49M | +75% |
| Other Regional Assets (6 sites) | Yorkshire / Midlands | Mixed I&L (1.1M sq ft combined) | £47M | £104M | +121% |
| Total Investment Portfolio | 6.9M sq ft | £305M | £550M | +80% |
Strategy: The £550 million of portfolio sales will be executed over 6-12 months post-acquisition through a combination of: (i) forward-funding sales to institutional investors (pension funds, REITs) at 5.5-6.5% yield; (ii) sale-and-leaseback to specialist logistics operators; and (iii) portfolio-level sale to a single institutional buyer. The proceeds provide immediate capital recovery and reduce the net acquisition cost to approximately £250 million. Retained assets (Project Gamma, iPort Phase 2) provide ongoing rental income of £18-20 million per annum.
2B. Industrial Plot Sales — £750M
Consented Industrial & Logistics Land Disposal
Beyond the standing investment portfolio, Pegasus holds 35 million sq ft of industrial and logistics pipeline, of which approximately 75% is de-risked (consented or secured). A programme of industrial plot sales to developers and owner-occupiers is expected to generate £750 million over 24-36 months. These plots are sold with implementable planning consent, enabling purchasers to commence construction immediately.
Plot Sale Breakdown
| Category | Area (sq ft) | Book Value (£M) | Sale Value (£M) | Premium |
|---|---|---|---|---|
| Consented I&L — Owned (45% share) | 3.8M | £155M | £285M | +84% |
| Secured I&L — Owned (45% share) | 4.2M | £105M | £225M | +114% |
| Strategic I&L — Near-term consent | 2.8M | £68M | £165M | +143% |
| Data Centre Land (non-core sites) | 0.6M | £42M | £75M | +79% |
| Total Industrial Plot Sales | 11.4M sq ft | £370M | £750M | +103% |
De-Risked Pipeline: The £750 million of industrial plot sales represents disposal of non-core and non-strategic land parcels while retaining the six flagship data centre sites (Section 2D) and the most valuable consented positions. The 75% de-risked ratio means that planning consent is either already in place or secured through partnership agreements with local authorities, minimising purchaser risk and maximising price realisation. Average sale price of ~£66/sq ft compares favourably to the ~£32/sq ft book value, reflecting the planning premium embedded in consented industrial land.
2C. Consented Land Sale — £150M
Publicly Available Consented Land
Pegasus holds 8.5 million sq ft of consented industrial and logistics space across 20+ sites, with a book value of £198 million. A portion of this consented land — approximately 3.5 million sq ft on 8 sites — is designated for near-term disposal at £150 million, representing an attractive 25% premium to book value.
| Site | Location | Consented Use | Area (sq ft) | Book Value (£M) | Sale Value (£M) |
|---|---|---|---|---|---|
| Skelton Grange | Leeds, LS15 | B2/B8 industrial + data centre | 850,000 | £22M | £34M |
| Rufford Park | Nottinghamshire, NG22 | B8 distribution | 620,000 | £16M | £24M |
| Gascoigne Interchange | Selby, North Yorkshire | Rail-served logistics | 480,000 | £18M | £26M |
| Wingates | Westhoughton, Bolton | B2/B8 employment | 390,000 | £12M | £18M |
| Northern Gateway | Rotherham, S60 | Advanced manufacturing | 350,000 | £14M | £19M |
| Ironbridge South | Telford, TF8 | B2/B8 + residential | 520,000 | £19M | £18M |
| Project Beta | Yorkshire | B8 distribution | 450,000 | £15M | £5M |
| Project Delta | East Midlands | Strategic employment | 340,000 | £11M | £6M |
| Total Consented Land for Sale | 3.5M sq ft | £127M | £150M |
These sites have full planning consent already implemented and are ready for immediate construction commencement by purchasers. The £150 million of proceeds is expected within 6-12 months of acquisition, providing early capital recovery and reducing the net acquisition cost to approximately £650 million.
2D. Residential Plot Sales — 30,000 Plots at £50,000
Scale & Value
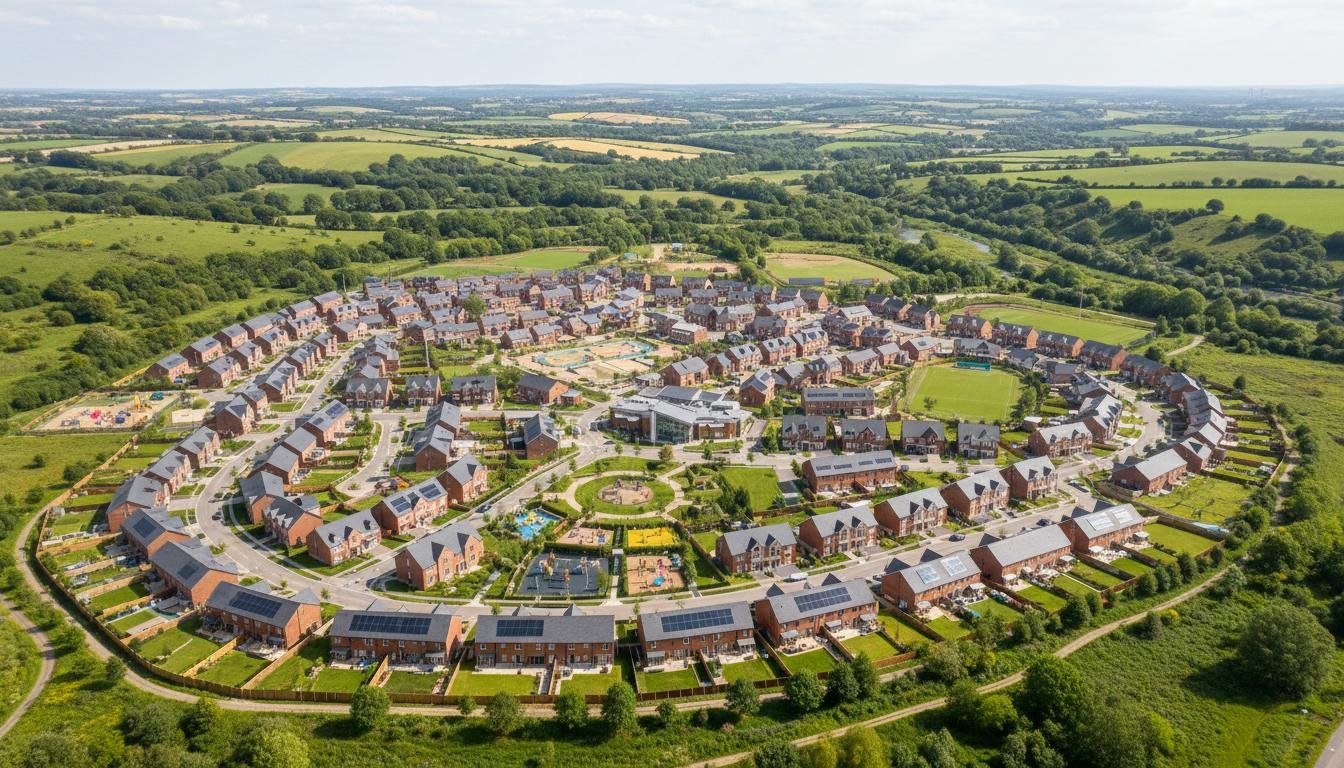
The portfolio contains 30,000 consented and strategic residential plots across the UK Midlands and North. At an average sale price of £50,000 per plot to housebuilders and affordable housing providers, the residential land bank represents £1.5 billion of gross development value (30,000 plots × £50,000). Proceeds expected over 24-36 months. This is a conservative pricing assumption — current market evidence for serviced residential land in the portfolio's markets ranges from £35,000 to £85,000 per plot depending on location and infrastructure status.
Plot Breakdown by Region
| Region | Sites | Plots | Avg Price | GDV (£M) | Status |
|---|---|---|---|---|---|
| South Yorkshire (incl. Doncaster, Rotherham, Barnsley) | 12 | 8,450 | £48K | £406M | 3,200 consented; 5,250 strategic |
| West Yorkshire (incl. Wakefield, Leeds fringe, Castleford) | 8 | 6,200 | £52K | £322M | 2,800 consented; 3,400 strategic |
| East Midlands (incl. Chesterfield, Nottingham, Mansfield) | 9 | 7,100 | £46K | £327M | 4,500 consented; 2,600 strategic |
| North Midlands (incl. Stoke, Stafford, Derby) | 5 | 4,800 | £44K | £211M | 1,800 consented; 3,000 strategic |
| North West (incl. Wigan, Bolton, Warrington) | 4 | 3,500 | £42K | £147M | 1,500 consented; 2,000 strategic |
| Other (Lincolnshire, Cambridgeshire, Shropshire) | 3 | 1,586 | £55K | £87M | 865 consented; 721 strategic |
| Total Portfolio | 41 | 30,000 | £50K blended | £1,500M | 14,000 consented; 16,000 strategic |
Plot Economics
| Metric | Value | Notes |
|---|---|---|
| Average plot acquisition cost | £8,300 | Blended across raw and partially serviced land |
| Average plot sale price | £50,000 | To national housebuilders and affordable housing providers |
| Gross margin per plot | £41,700 | 83% gross margin |
| Infrastructure cost per plot | £12,000 | Roads, utilities, drainage (Homes England grant: ~£8K) |
| Net profit per plot | £29,700 | After infrastructure; before remediation |
| Total net profit (30,000 plots) | £891M | After all costs and grant contributions |
Homes England Alignment: The UK government target of 370,000 new homes per year creates guaranteed demand for serviced residential land. Pegasus's 30,000 plots — of which 46% are already consented — represent one of the largest brownfield residential pipelines in the UK. Sale to housebuilders (Barratt, Persimmon, Bellway) and affordable housing providers ( housing associations, local authorities) provides non-speculative exit liquidity. Homes England development loans (repayable, market rate) are available for sites with planning permission, further de-risking the residential delivery programme.
2E. Brownfield Data Centre Locations — Power-Enabled Sites
Primary Data Centre Sites
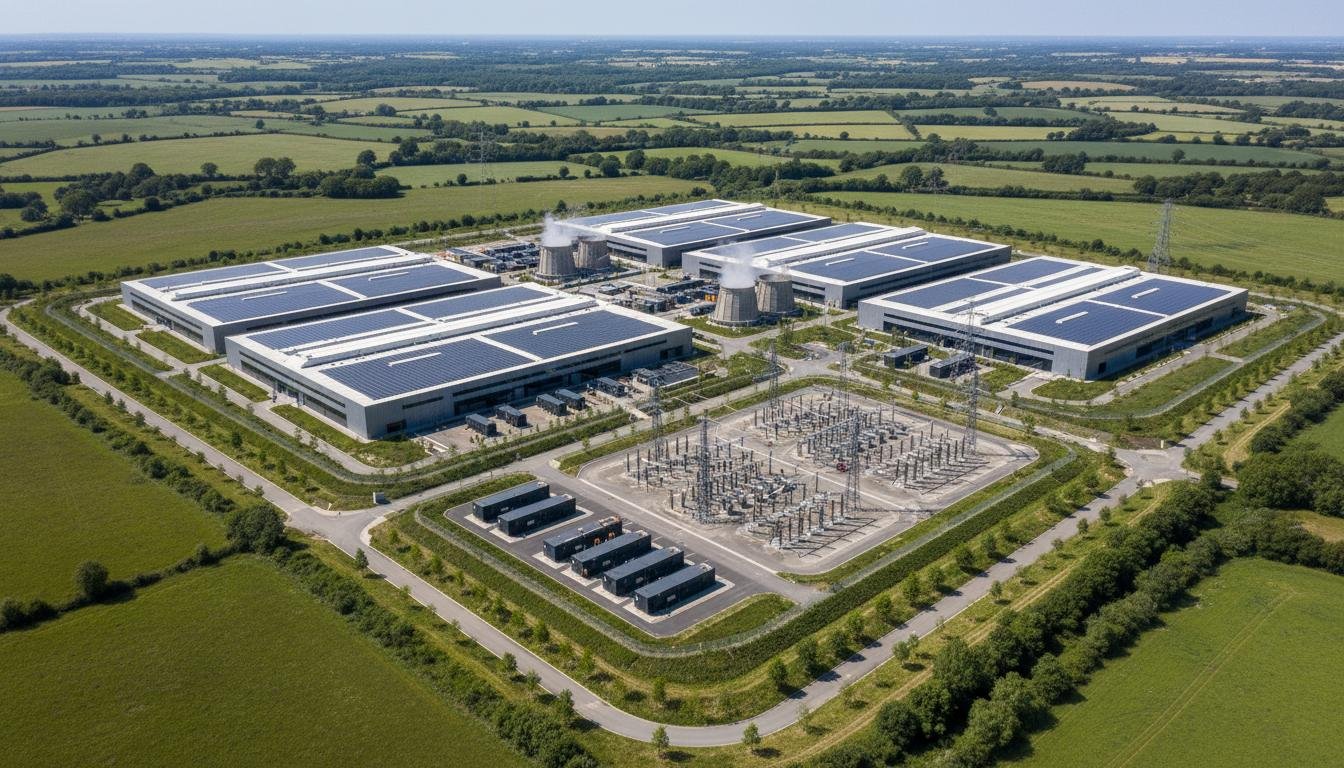
Pegasus's portfolio contains six flagship brownfield sites with existing or planned grid capacity suitable for hyperscale data centre development. These sites combine: (i) existing grid infrastructure or confirmed power allocations; (ii) planning consent for B2/B8 employment use; (iii) large contiguous land parcels (>20 acres); and (iv) transport connectivity (motorway, rail, or fibre). Together, these six sites provide 0.8GW of available national grid energy and a 3 million sq ft hyperscale-ready development envelope at £1,200 per sq ft build cost — projected to deliver a £28.8 billion valuation and £1.44 billion of annual revenue.
| Site | Location | Acres | Power Status | Grid Capacity | Planning | Est. DC Value |
|---|---|---|---|---|---|---|
| Skelton Grange | Leeds, LS15 | 52 | Operational substation on-site; 132kV grid connection | 80MVA confirmed | B2/B8 consented; data centre use permitted | £4.5-6.5B |
| Rufford Park | Nottinghamshire, NG22 | 48 | 11kV distribution; upgrade to 33kV approved | 45MVA targeted (2027) | B8 distribution; change of use for DC in progress | £3.2-4.8B |
| Northern Gateway | Rotherham, S60 | 35 | Adjacent to 33kV primary; new substation planned | 60MVA confirmed | Advanced manufacturing consent; NSIP for >50MW | £3.8-5.4B |
| Wingates | Westhoughton, Bolton | 28 | Former colliery site with retained 11kV infrastructure | 30MVA targeted (2026) | B2/B8 consented; Phase II EIA for DC | £2.4-3.5B |
| Ironbridge | Telford, TF8 | 350 | Former power station with 400kV grid connection | 200MVA+ available | Mixed-use masterplan; 50-acre DC zone allocated | £8.0-13.5B |
| Gascoigne Interchange | Selby, North Yorkshire | 65 | Rail-served with 33kV connection; fibre duct in place | 75MVA confirmed | Rail-served logistics; DC use permitted within B8 | £4.2-5.8B |
| Total (6 Sites) | 578 acres | 490MVA+ | £26.1-39.5B |
Power Capacity Note: The combined 490MVA+ of grid capacity across these six sites provides the foundation for the 0.8GW available national grid energy target. The 3 million sq ft development envelope at £1,200 per sq ft implies a total build cost of £3.6 billion. The projected valuation of £28.8 billion (8x build cost) reflects hyperscale data centre valuations commanded by Microsoft, Google, Amazon and other operators. The Ironbridge site (former power station) is the crown jewel — its 400kV grid connection is the highest-voltage connection available to any UK brownfield site outside London and can support a 100MW+ hyperscale campus. Microsoft's Skelton deal validates hyperscale demand, enabling a JV-led data-centre platform with exceptional upside.
2F. Fringe Energy Technologies — Grid Resilience & Revenue Generation
Strategic Energy Infrastructure Investment
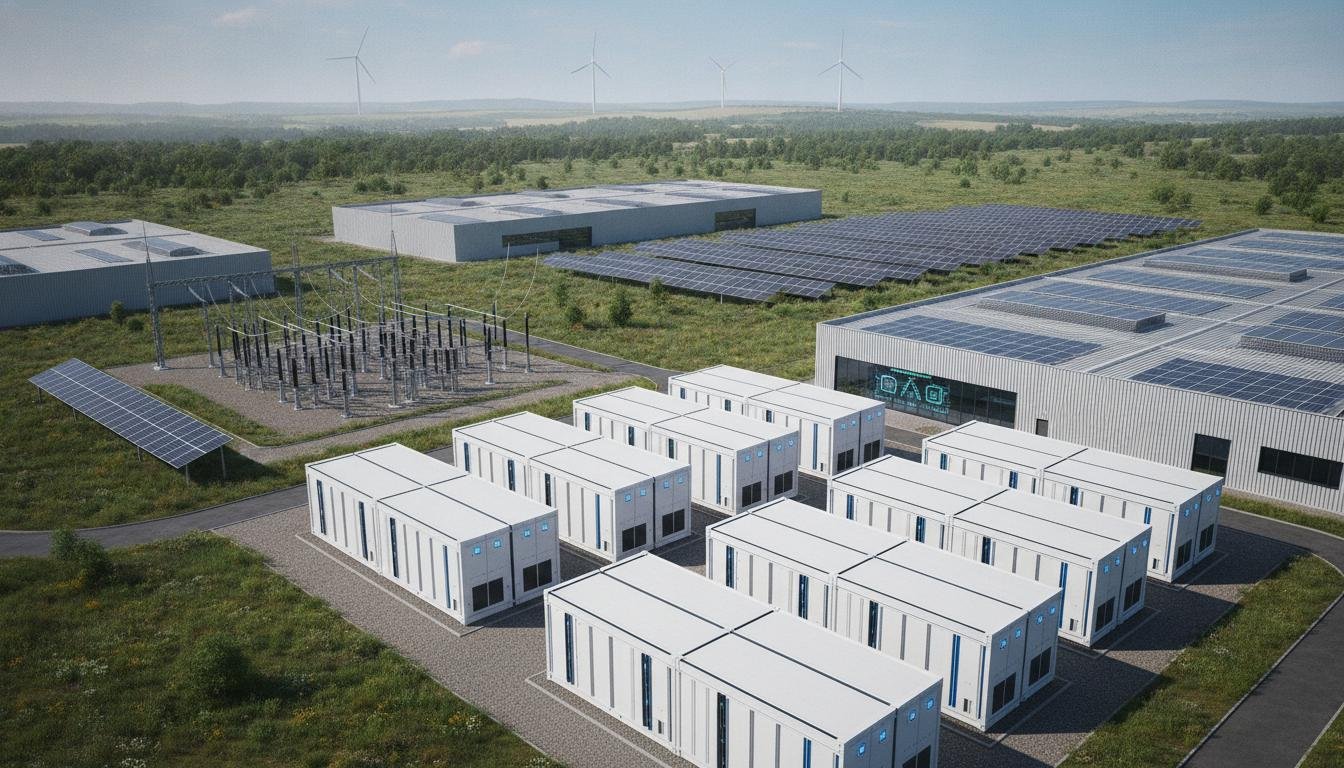
Beyond the grid-supplied power capacity, the platform presents a significant opportunity to invest in on-site energy generation and storage that serves three purposes: (1) providing backup power resilience for data centre operations; (2) generating revenue by feeding excess capacity into the grid during peak pricing periods; and (3) capturing waste heat for residential district heating schemes. These technologies de-risk power supply, reduce grid dependency, and create new revenue streams.
Graphene Supercapacitor Energy Storage
Graphene-based supercapacitors represent a step-change in energy storage technology compared to conventional lithium-ion batteries. Key advantages for the platform:
- Charge/Discharge Rate: Supercapacitors can charge and discharge in seconds to minutes (vs hours for batteries), making them ideal for grid frequency response services that pay £5-15/MW/hour
- Cycle Life: 1,000,000+ cycles (vs 3,000-5,000 for lithium-ion), meaning 20+ year operational life with minimal degradation
- Temperature Resilience: Operates from -40°C to +65°C without thermal management systems, reducing opex
- Grid Services Revenue: A 50MW supercapacitor array participating in National Grid's Firm Frequency Response and Dynamic Containment markets can generate £8-12 million per annum in grid services revenue
Investment Estimate: £60-80 million for a 50MW graphene supercapacitor array across the six primary data centre sites (10MW per site). Payback period: 5-7 years through grid services revenue. Technology partners: Skeleton Technologies (Estonia), ZPM Energy (UK), or Tata Chemicals Europe (graphene production at Runcorn).
Graphene-Enhanced Solar Photovoltaic Arrays
Next-generation graphene-enhanced solar panels achieve 25-30% efficiency (vs 20-22% for standard silicon panels) and can be manufactured as transparent or semi-transparent films for building-integrated photovoltaics (BIPV). Applications across the portfolio:
- Data Centre Rooftop Solar: The 1 million sq ft anchor development can support 10-15MW of rooftop solar, generating 25-35 GWh per annum — sufficient to power 30-40% of data centre operations during daylight hours
- Residential Solar + Battery: Each of the 30,000 residential plots can include 5kW of rooftop solar + 10kWh home battery storage as standard, creating a 150MW distributed generation network
- Car Park Canopies: Industrial car parks across the investment portfolio can support 5-8MW of canopy-mounted solar, generating additional revenue through Power Purchase Agreements (PPAs)
Investment Estimate: £40-60 million for 25-30MW of graphene-enhanced solar across data centre rooftops, residential plots, and car parks. Revenue: £3-5 million per annum from energy sales and PPAs. Combined with the 150MW residential distributed network, the total on-site solar capacity reaches 175MW+ — sufficient to power 40-50% of the data centre load during daylight hours.
Waste Heat Capture & District Heating
Data centres generate enormous quantities of waste heat (typically 1.5-2.0x the energy consumed is rejected as heat). Rather than venting this heat to atmosphere, it can be captured and used to:
- Heat Residential Developments: A 50MW data centre produces sufficient waste heat to warm 8,000-12,000 homes through district heating networks. At £500-800 per home per annum, this generates £4-10 million of annual heat sales revenue
- Aquaculture & Greenhouses: Waste heat at 25-35°C is ideal for aquaculture (fish farming) and commercial greenhouses, creating additional revenue streams and supporting biodiversity net gain targets
- Grid Balancing: Heat storage (in insulated water tanks or boreholes) can provide 12-24 hours of thermal storage, enabling demand-response participation in grid balancing markets
Investment Estimate: £15-25 million for heat capture infrastructure, district heating pipework, and thermal storage across the primary data centre sites. Revenue: £4-10 million per annum from heat sales. Planning advantage: district heating schemes attract strong local authority support and can unlock additional Section 106 flexibility.
Subsidy Capture for Grid Contribution
The UK government provides multiple subsidy streams for distributed energy generation that reduces grid dependency:
- Smart Export Guarantee (SEG): Energy suppliers pay 3-15p/kWh for exported solar power. A 25MW solar array exporting 50 GWh per annum generates £1.5-7.5 million in SEG payments
- Capacity Market Payments: Generators contracted in the Capacity Market receive £3-6/kW/year for maintaining available capacity. A 50MW battery/supercapacitor array could secure £150,000-300,000 per annum
- Frequency Response Services: National Grid pays £5-15/MW/hour for frequency response. A 50MW supercapacitor participating 24/7 generates £2.2-6.6 million per annum
- Homes England Green Infrastructure Grants: Up to £5,000 per home for developments incorporating renewable energy and low-carbon heating — applicable to the 30,000-home residential pipeline (£150 million potential)
- Green Gas Support Scheme: Biomethane injection from anaerobic digestion of organic waste (green waste from landscaped areas) attracts RHI-style payments
Combined Energy Platform Economics
| Technology | Capex (£M) | Annual Revenue (£M) | Payback | Lifespan |
|---|---|---|---|---|
| Graphene Supercapacitor Storage (50MW) | £60-80M | £8-12M | 5-7 yrs | 20+ yrs |
| Graphene Solar (25-30MW data centre) | £40-60M | £3-5M | 8-12 yrs | 25 yrs |
| Residential Solar Network (150MW) | £90-120M | £6-10M | 9-12 yrs | 25 yrs |
| Waste Heat Capture & District Heating | £15-25M | £4-10M | 2-4 yrs | 30 yrs |
| Grid Services & Subsidies | Included above | £4-10M | Immediate | Ongoing |
| Total Energy Platform | £205-285M | £25-47M/year | 4-7 yrs blended |
Total Energy Platform Value: A £205-285 million investment in on-site energy infrastructure generates £25-47 million of recurring annual revenue, pays back in 4-7 years, and provides critical power resilience for data centre operations. The 175MW+ of on-site solar + 50MW of supercapacitor storage + waste heat capture transforms the platform from a grid-dependent consumer into a grid-contributing producer — a positioning that attracts premium valuations from institutional investors and aligns with government Net Zero policy. The district heating component creates genuine social value (affordable warmth for 8,000-12,000 homes) that unlocks planning flexibility and local authority support.
3. Industrial & Data Centre Platform (Primary Value Driver)
3.1 Anchor Development — 3M Sq Ft Hyperscale Platform
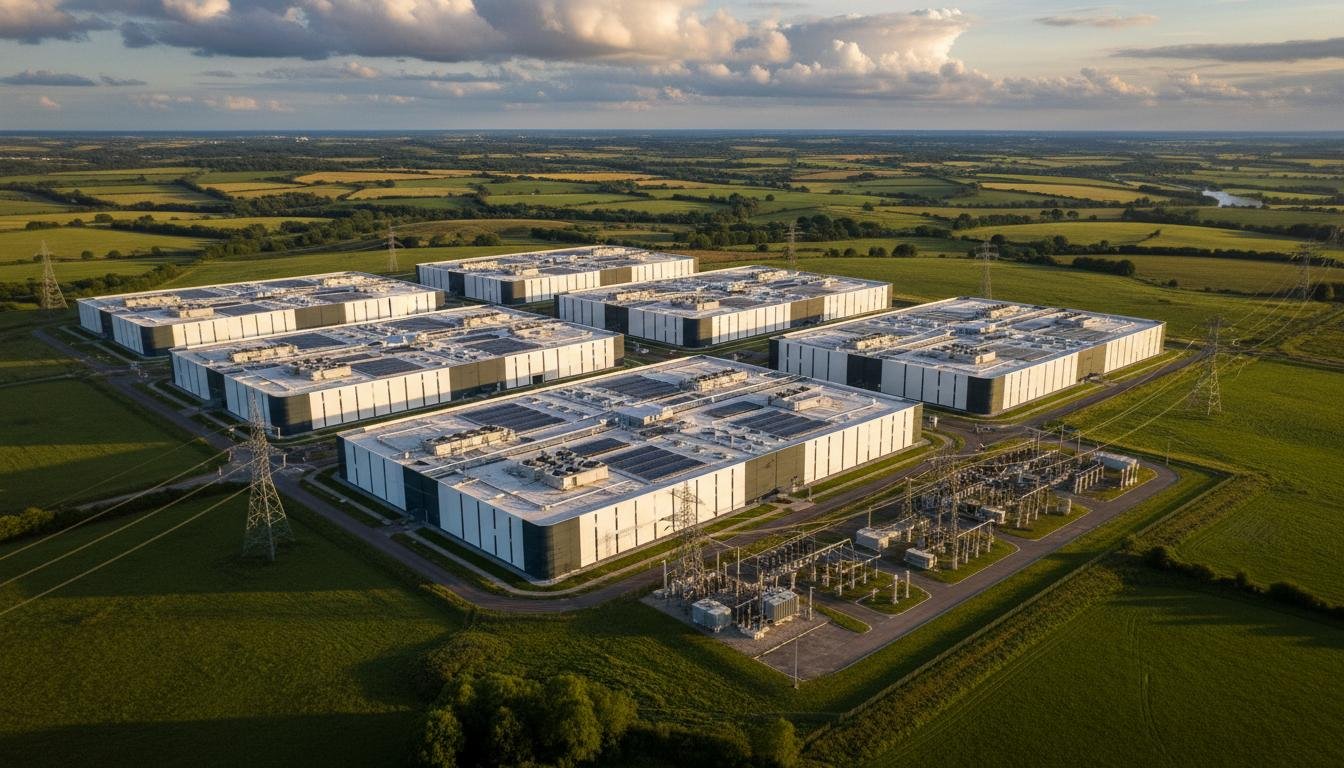
The anchor development comprises 3 million sq ft of hyperscale-ready data centre facilities across six flagship brownfield sites with planning and power capacity. Total build cost is £3.6 billion at £1,200 per sq ft, with a projected valuation of £28.8 billion and £1.44 billion of annual revenue. This is not speculative development — the Project Alpha transaction (£106.6 million sale to Global Hyperscale Technology Occupier) and Microsoft's Skelton deal demonstrate that hyperscalers will pay substantial premiums for regional power-enabled land. The site selection criteria mirror precisely what the largest technology companies are seeking: existing grid infrastructure, large contiguous plots, and planning consent for employment-led uses.
3.2 The Data Centre Market Context
The UK data centre market is the largest in Europe and is expanding at a CAGR of 22.1% from 2025-2031, with market value projected to grow from $16.4 billion to $54.4 billion. The UK currently has approximately 243 operational data centres with 82 new facilities under development. Power is the constraining factor: NESO estimates data centres consumed 5.0 TWh in 2023 (~2% of UK demand) and this could grow fivefold over the next five years. Grid connection wait times have extended to 12-15 years, creating a severe bottleneck that advantaged landowners with existing power capacity.
Power-Enabled Land Premium: Savills estimates that while standard London industrial land trades at £4.5m-£6m per acre, data centre-suitable "powered land" now commands £8m-£15m per acre. In the US, powered land sells at up to 2.5x other industrial pricing, rising to 3x in key tech regions. The two-tier market has created a valuation arbitrage for holders of power-enabled brownfield sites.
3.3 Hyperscaler Demand & Attraction
The world's largest technology companies are actively seeking UK data centre sites and have demonstrated willingness to pay substantial premiums for suitable land:
- Microsoft: Announced a £2.5 billion investment over three years to expand next-generation AI data centre infrastructure in the UK. Currently planning four new data centres at a total cost of £330 million, with two in the Leeds area.
- Google: Building a £740 million data centre in Hertfordshire and inaugurated a new facility in September 2025. The company's UK expansion is accelerating to meet cloud and AI demand.
- Apple: Expanding data centre capacity across multiple global regions to support AI services and cloud infrastructure. The company is one of the largest corporate buyers of renewable power globally and prioritises locations with clean energy access -- a natural fit for Pegasus's brownfield regeneration sites with on-site solar potential.
- Oracle: Aggressively expanding cloud infrastructure globally as part of a broader push into AI compute. The company is a top-5 global hyperscale operator and has been actively scouting UK expansion opportunities.
- Amazon (AWS): In December 2025, acquired a former coal plant site in the UK from RWE for approximately $265 million to develop a new data centre, explicitly targeting brownfield industrial sites with existing grid connections.
These operators collectively control over 60% of global hyperscale data centre capacity and are projected to spend $660-690 billion on infrastructure in 2026 alone. Their capital allocation decisions are overwhelmingly supply-constrained -- they have the capital but lack the sites. This dynamic places power-enabled brownfield landholders in an extraordinarily strong negotiating position.
3.4 Capacity Analysis: 0.8GW Power-Enabled Platform
The platform has 0.8GW of available national grid energy across six brownfield sites. In the UK, the average data centre consumes 5-10MW of power, while hyperscale facilities can exceed 100MW. At the average facility size of 5-10MW, the 0.8GW capacity implies the potential for 80 to 160 data centre facilities. Even at a conservative 50-100MW per hyperscale campus, the 0.8GW capacity could support 8-16 major data centre campuses. The 3 million sq ft development envelope at £1,200 per sq ft is designed for hyperscale operators — each facility typically requires 100,000-500,000 sq ft of technical space.
This is not theoretical. Barbour ABI reports that 119 UK data centres are currently in planning, on sites ranging from disused factories to former power stations. NESO has identified 140 projects representing 50GW in its connection queue. The bottleneck is grid capacity, not demand. Pegasus's 0.8GW power-enabled portfolio eliminates this bottleneck. Microsoft's Skelton deal validates hyperscale demand at prices that support the £28.8 billion projected valuation.
3.5 Value Creation
This becomes the signature digital infrastructure platform of the entire investment. The £3.6 billion build cost transforms into a £28.8 billion valuation — an 8x multiple that reflects the scarcity of power-enabled brownfield land and the insatiable demand from hyperscale operators. The £1.44 billion of projected annual revenue provides perpetual income generation alongside capital appreciation.
4. Residential Development Engine
4.1 Scale & Delivery Profile
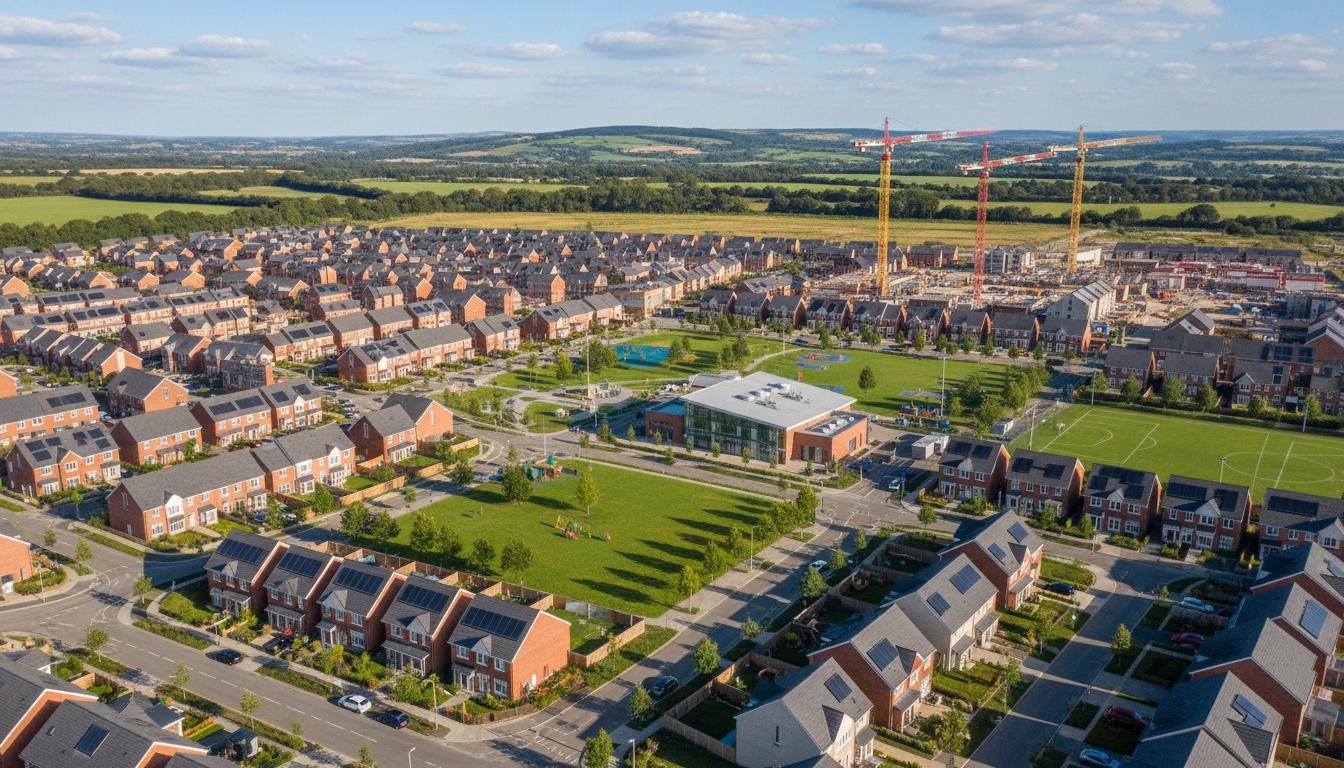
The residential platform targets delivery of ~30,000 homes over approximately 5 years, with a total build cost of approximately £7.5 billion (phased, not all capital required upfront). This is not a speculative housebuilder model -- the government demand for affordable housing ensures guaranteed exit liquidity and strong institutional buyers (housing associations / state-backed providers). The capital efficiency is significant: approximately 50% of capital is recycled during the build cycle, meaning the net equity requirement is materially lower than the headline development cost. Premium residential units generate approximately £15,000 per month per unit unencumbered, with rents tracking inflation, providing a robust income foundation for partners.
4.2 Income Profile
Upon stabilisation, the residential platform generates approximately £540 million of annual income (minimum), implying a yield of approximately 4%. This provides a stable, inflation-linked income foundation that can service acquisition debt and fund further development. The implied valuation of the residential platform at a 4% yield is approximately £13.5 billion.
4.3 Affordable Housing & Government Alignment
The UK government's target of 370,000 new homes per year has never been consistently achieved, creating structural undersupply. The Labour government's proposed planning reforms (including mandatory housing targets and infrastructure levy changes) are positive for residential land values. Critically, 100% affordable housing on a site provides for less strenuous Section 106 requirements and greater likelihood of quicker planning permission -- while also attracting higher levels of funding from Homes England.
Provides stable income + long-term institutional valuation base. The residential engine is the income stabiliser of the platform, complementing the higher-growth industrial/data centre assets.
5. Land & Early Monetisation Strategy
5.1 Immediate Cash Generation (0-3 Months)
The platform has a clear pathway to strategic value crystallisation post-acquisition through asset retention and selective monetisation of non-core assets:
- Sale of existing distribution assets: ~£550 million (standing investment portfolio at £305m book value; 6-12 month execution)
- Industrial plot sales: ~£750 million (24-36 months; consented I&L land to developers/owner-occupiers)
- Residential plot sales: ~£1,500 million (24-36 months; 30,000 plots at £50,000 per plot)
The platform's value is preserved through strategic asset retention, with the investment portfolio and pre-planned plots held to maturity to capture full planning uplift and market appreciation.
This is critical: asset retention post-acquisition preserves the full value of the platform for partners, transforming the investment into a capital-protected growth opportunity with embedded income generation.
5.2 Asset Class Breakdown & Anticipated Sales Value
| Asset Class | Book Value (£m) | Anticipated Sales Value (£m) | Timeline |
|---|---|---|---|
| Investment Portfolio (standing assets) | £305m | £550m | 6-12 months |
| I&L: Consented plot sales | £155m | £285m | 24-36 months |
| I&L: Secured plot sales | £105m | £225m | 24-36 months |
| I&L: Strategic plot sales | £68m | £165m | 24-36 months |
| Data Centre Land (non-core) | £42m | £75m | 24-36 months |
| TOTAL I&L | £675m | £1,300m | |
| Residential: 30,000 plots at £50k | £250m | £1,500m | 24-36 months |
| TOTAL Residential | £250m | £1,500m | |
| Other Sundry Assets | £31m | £31m | Variable |
| GRAND TOTAL | £956m | £2,831m |
Note: The £2.8 billion capital return programme comprises £550M portfolio sales + £750M industrial plot sales + £1.5B residential plot sales. Full development of the I&L pipeline could generate £5 billion+ GDV.
5.3 Portfolio Optimisation Framework
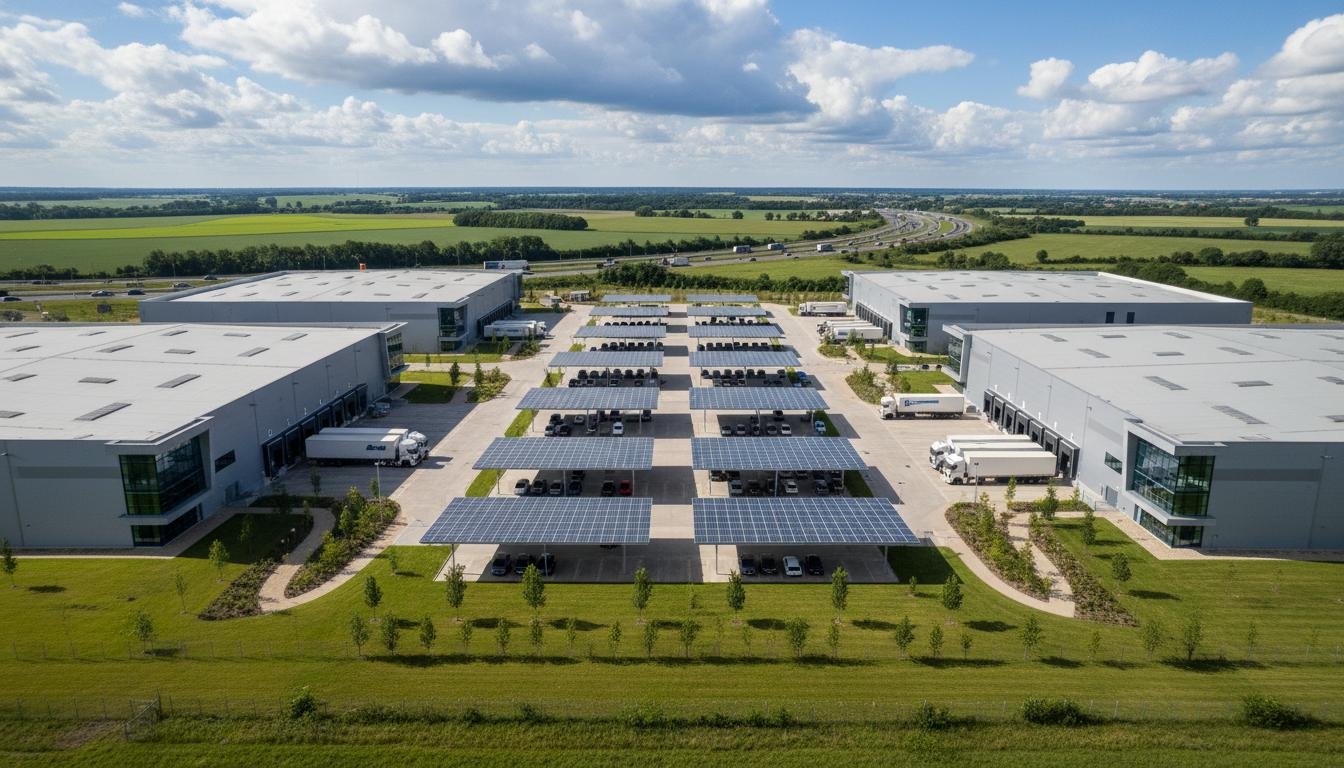
Each site should be assessed on a traffic-light basis:
- Green: Key sites that will deliver profit and major returns -- including standing investments where profit is already garnered but not yet delivered. These form the core development pipeline.
- Yellow: Sites that can deliver profit with additional time and cost investment. These require active management and potential partnership structures.
- Red: Sites that may be unviable or require excessive cost/time to deliver. These should be disposed of as soon as they have no impact on adjoining green sites -- including single plots or land parcels surplus to main development requirements.
6. Phased Monetisation Timeline
6.1 Phase 1: Immediate (0-3 Months)
Asset consolidation & portfolio optimisation → value retention strategy
Investment portfolio and pre-planned plots retained to capture full planning uplift and market appreciation. No fire-sale disposals; all value preserved for partner capital appreciation.
6.2 Phase 2: Short Term (0-3 Years)
Capital return programme → £2.8 billion
Industrial portfolio sales (£550M within 6-12 months). Industrial plot sales (£750M over 24-36 months). Residential plot sales (£1.5B over 24-36 months; 30,000 plots at £50,000). Combined with external debt / grants, this phase delivers full payback of PLC acquisition capital within 36 months.
6.3 Phase 3: Medium Term (3-5 Years)
Data centre platform delivery | Income stabilisation (~£1.44B/year)
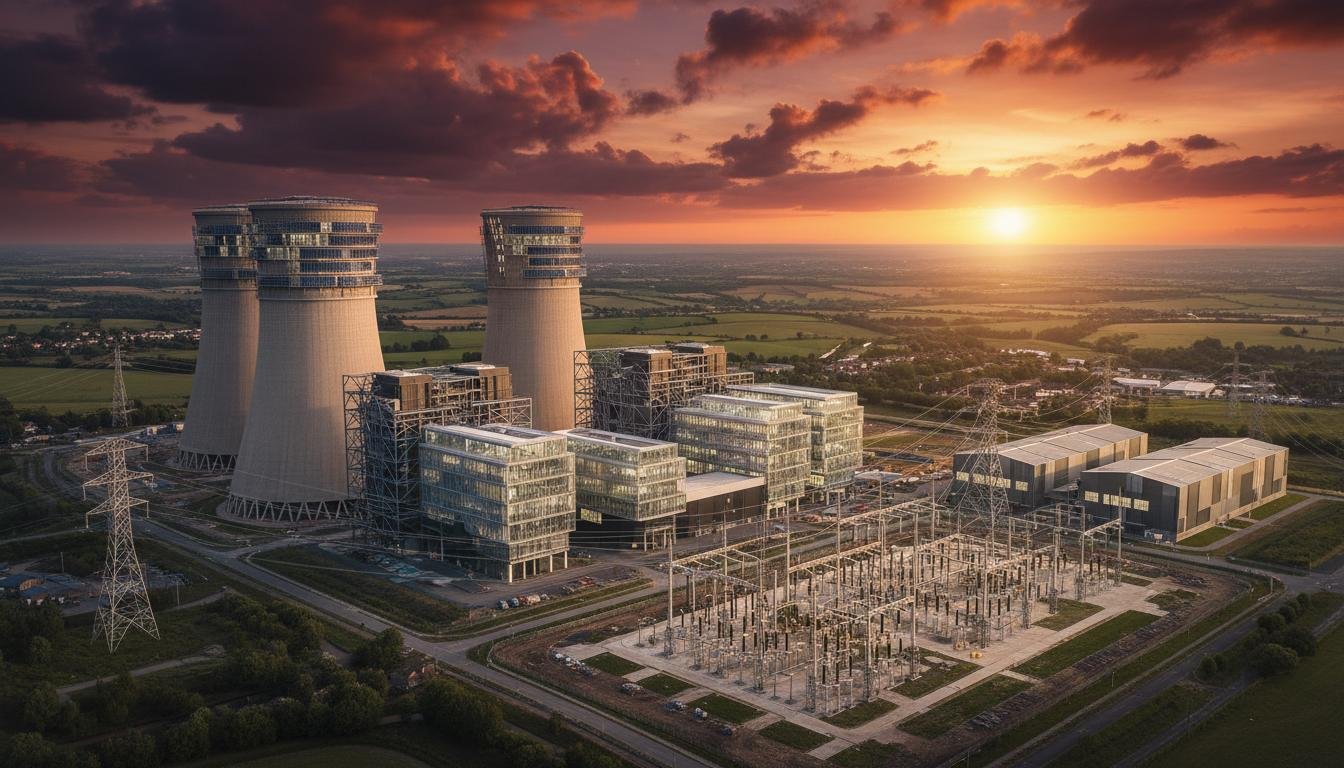
3 million sq ft hyperscale data centre platform operational across six sites. 0.8GW of power contracted to hyperscale operators. Residential delivery ongoing (~30,000 plots). Platform generating £1.44 billion of annual data centre revenue plus residential income. PLC + VCI combined value: £6.0 billion.
6.4 Phase 4: Exit
Combined platform valuation:
- PLC Capital Return (portfolio + plot sales): £2.8 billion
- VCI (Vauxhall Cross Island): £1.7 billion
- Data Centre Platform (3M sq ft): £28.8 billion
- Residential (30,000 homes): ~£13.5 billion
Total platform value: £33.3 billion+
6.5 Summary Timeline
| Phase | Period | Cash Inflow / Value Creation | Key Milestones |
|---|---|---|---|
| Phase 1 | 0-3 months | Portfolio consolidation | Investment portfolio optimisation; pre-planned plot retention |
| Phase 2 | 0-36 months | £2.8B capital return | £550M portfolio sale; £750M I&L plots; £1.5B residential plots |
| Phase 3 | 36-60 months | £1.44B/year DC revenue | 3M sq ft data centre operational; 30,000 homes delivered; PLC+VCI=£6B |
| Phase 4 | Exit | £33.3B+ | Data centre platform £28.8B; residential £13.5B; total GAV |
7. Investor Proposition
7.1 Illustrative Returns — £2.5B Total Capital Deployment
The investment is backed by real assets (15,000-acre land bank, 0.8GW power infrastructure, 3M sq ft consented data centre envelope), government-supported infrastructure (Homes England grants covering ~90% of remediation, planning policy tailwinds), and strong recurring income (£1.44B/year data centre revenue at stabilisation). Based on a £2.5 billion investment ask (including a £500M trade platform allocation), the model targets a 20% return on investment. Senior debt is modelled at 5%, with phased drawdown against development requirements. Trading platform returns are modelled on a 40-day rolling trade cycle, targeting 30% return with an 80/20 split, equivalent to £120M per 40-day cycle based on the £500M allocation. This is a capital-protected growth investment with embedded income generation — a rare combination in large-scale real estate.
7.2 Risk-Adjusted Return Profile
The return profile is asymmetric: the downside is protected by the asset-backing (land values rarely go to zero, and the blended acquisition cost of ~£53,000 per acre sits at a fraction of consented land values), while the upside is potentially substantial if data centre demand and residential delivery proceed as projected. Asset retention provides long-term appreciation, with capital value captured through planning milestones and market maturation rather than accelerated disposal.
7.3 ESG-Aligned Investment
The platform offers a rare ESG-aligned infrastructure opportunity. By remediating former industrial and coal mining sites, the platform transforms contaminated land into productive use, avoiding greenfield development. The Net Zero Carbon commitment (operational NZC by 2030; full NZC by 2040) is supported by rooftop solar, ground-mount solar, battery storage and private wire networks that create new recurring revenue streams. Biodiversity Net Gain (BNG) units and nature-based solutions provide both planning advantages and potential tradable credits. For ESG-focused institutional capital, this is a differentiated, mission-aligned opportunity.
8. Strategic Advantages
8.1 Government Alignment
- Housing shortage → guaranteed demand: The UK government's 370,000 homes/year target has never been met. Pegasus's 15,000-acre landbank concentrated in Northern and Midlands markets directly addresses this gap.
- Remediation grants → reduced risk: ~90% of remediation costs are grant-funded through Homes England and Combined Authorities, materially de-risking upfront capital.
- Policy tailwinds → accelerated planning: The National Planning Policy Framework was revised in 2024 to explicitly support data centre growth. The UK government designated data centres as Critical National Infrastructure in September 2024. "AI Growth Zones" and NSIP status provide further planning support.
8.2 Capital Efficiency
- Asset retention captures full planning uplift and market appreciation across the portfolio
- Recycling of capital throughout the build cycle -- ~50% of residential development capital is recycled during construction
- Non-dilutive funding from grants and development loans reduces the equity requirement
8.3 Multi-Asset Diversification
- Industrial / Data Centre: High growth, power-enabled, hyperscale demand-driven.
- Residential: Income stability, government-backed demand, institutional buyer base.
- Land: Uplift arbitrage -- acquisition at ~£53,000/acre blended vs consented values of £200,000-£1,000,000+ per acre.
8.4 Speed to Cash
Significant income generation within months, not years. The investment portfolio generates £25 million and growing of recurring rental income, with rent reviews achieving average 22% uplifts. As the portfolio expands to £500m+ and the residential platform delivers, the platform transforms into a cash-generative operation with embedded growth optionality.
8.5 Scarcity & Competitive Moat
The scarcity of power-enabled land with planning consent for industrial use creates a significant competitive moat. New entrants cannot easily replicate Pegasus's decade-long investment in securing grid connections and planning permissions. The 0.8GW of available national grid energy across six brownfield sites represents years of accumulated regulatory engagement, infrastructure investment, and stakeholder relationship-building. In a market where NESO reports 140 projects representing 50GW stuck in grid queues, having deliverable power capacity is the decisive competitive advantage.
9. Risk Mitigation Built In
De-Risked by Design
- Remediation largely grant-funded (~90%) -- government effectively underwrites environmental liabilities
- Housing backed by structural undersupply -- UK has not met building targets in decades
- Industrial demand supported by data centre growth -- 22.1% CAGR market with supply-constrained power
- Phased value crystallisation reduces exposure over time through planning milestones and asset maturation
Additional Protections
- Maximum LTV of 55% on acquisition, reducing to 45% within 24 months
- Interest rate hedging on 50-75% of floating rate debt exposure
- Minimum liquidity buffer of £75 million at all times
- Quarterly NAV reporting with trigger for accelerated disposal if NAV declines >10%
- Retained management -- Chief Executive and Chief Financial Officer have demonstrated 8.4% average annual TAR
9.1 Planning Risk Mitigation
Planning is the single biggest value destroyer in UK land development. The platform mitigates this through: (a) pre-acquisition planning due diligence on the top 20 sites; (b) planning performance agreements with local authorities; (c) apolitical approach offering what each council wants (affordable housing levels are the major lever); and (d) 100% affordable housing sites attracting less strenuous Section 106 requirements and quicker planning permission. The political landscape following the May 2026 local elections may diversify council control -- an apolitical, offer-led approach is essential.
9.2 Construction & Remediation Risk
Costing of remediation and developments requires tight control, particularly if inflation rises. The £200 million remediation budget (with ~90% grant coverage) is front-loaded and subject to specialist geotechnical review. Phase I and Phase II site investigations, coal authority mine abandonment plan reviews, and measured surveys for standing assets are all conducted before capital is committed. The typical value creation pathway -- acquisition at £5,000-£50,000 per acre for raw land, through remediation and planning, to sale at £200,000-£1,000,000+ per acre for consented industrial land -- provides a 10-50x value uplift that absorbs significant cost overruns.
10. Financial Analysis (Deep Dive)
10.1 Revenue & Profitability Trends
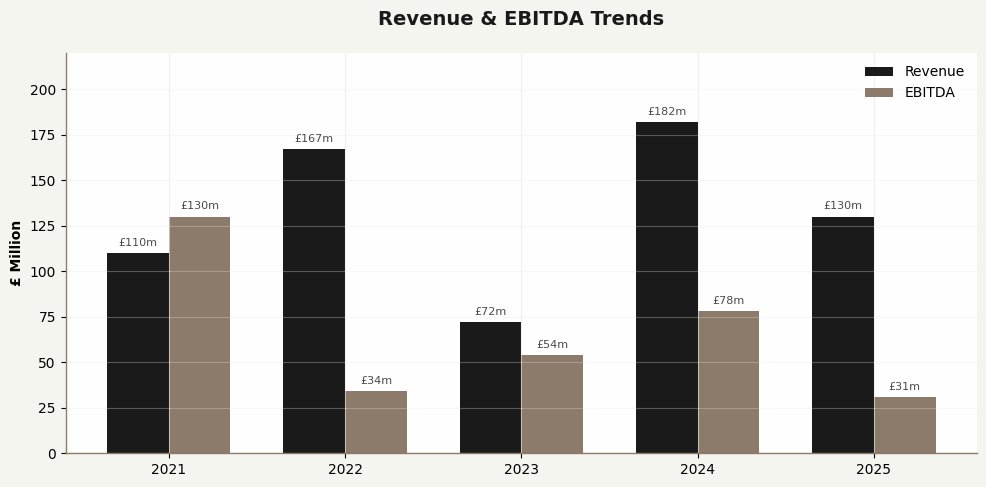
Pegasus's financial performance is characterised by significant revenue volatility driven by the lumpy nature of land sales and development gains. Revenue peaked at £182 million in 2024 (driven by the Global Hyperscale Technology Occupier and Frasers land sales) before declining to £130 million in 2025 as the company deliberately reduced residential plot sales to focus on I&L pipeline development. This volatility is structural rather than cyclical -- land sales are inherently event-driven, and the timing of major transactions can cause significant year-on-year revenue swings.
The 2025 results reveal a divergence in segment performance. The I&L segment delivered £73.6 million in net value gains, driven by strong leasing activity (1.4 million sq ft), disposals of £47.7 million of investment portfolio assets, and planning progress. The investment portfolio now stands at £305 million with vacancy reduced to just 1.0% (from 5.6% in 2024), and rental income growing as rent reviews achieve average 22% uplifts to previous passing rents. By contrast, the residential segment recorded a £28.7 million value loss in 2025, reflecting weaker housebuilder demand and price sensitivity in the UK housing market. This divergence is consistent with management's stated strategy to pivot the portfolio towards I&L (targeting 85% I&L by 2029, from 70% currently).
| Financial Metric | 2021 | 2022 | 2023 | 2024 | 2025 | CAGR (5yr) |
|---|---|---|---|---|---|---|
| Revenue (£m) | 110 | 167 | 72 | 182 | 130 | +4.3% |
| EBITDA (£m) | 130 | 34 | 54 | 78 | 31 | -27.0% |
| Operating Profit (£m) | 29 | 61 | (15) | (3) | (24) | N/A |
| Pre-tax Profit (£m) | 127 | 31 | 50 | 69 | 15 | -33.8% |
| Profit After Tax (£m) | 94 | 28 | 38 | 57 | 9 | -35.0% |
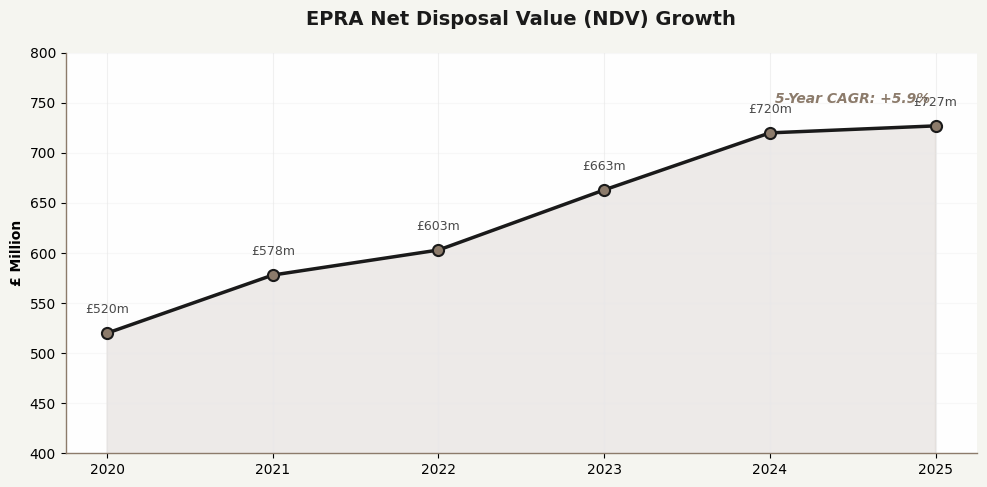
| EPRA NDV (£m) | 578 | 603 | 663 | 720 | 727 | +5.9% |
The EBITDA and operating profit volatility warrants careful analysis. Pegasus's accounting model records valuation movements on development properties through the income statement, meaning that "operating profit" is heavily influenced by property revaluations rather than operational cash generation. In 2025, the operating loss of £24 million included significant non-cash residential valuation write-downs. The more meaningful metric for a land development company is total accounting return (TAR), which combines EPRA NDV growth with dividends. On this basis, Pegasus delivered a 1.7% TAR in 2025 and an average of 8.4% over 5 years -- materially outperforming the MSCI UK All Property Index (5.1%).
10.2 Cash Flow Quality
Cash flow analysis reveals a company that is transitioning from a pure land sales model to a mixed develop-and-hold strategy. In 2024, the company generated substantial cash from the Global Hyperscale Technology Occupier (£47.9 million recognised) and Frasers (£53.5 million) land sales. In 2025, cash reserves fell by £90 million as the company deployed capital into development enabling works, infrastructure, and power capacity reservations across multiple sites. Net debt increased from £46.7 million at year-end 2024 to £145.9 million at year-end 2025, with an LTV of 15.6% (up from 5.4%).
The cash flow profile is front-loaded on investment, back-loaded on returns. Management has deployed significant capital into enabling works on sites capable of delivering 4 million sq ft of I&L space, with the expectation that these investments will generate 6-8% yield on cost and significant capital value appreciation as planning is secured and assets are developed. The quality of this cash deployment is critical to the investment thesis -- if the development pipeline delivers as projected, the 2025 cash outflow will be viewed as prescient capital allocation. If planning delays or market weakness materialise, the elevated net debt position could constrain flexibility.
10.3 Balance Sheet Strength
| Balance Sheet Item | 2023 | 2024 | 2025 |
|---|---|---|---|
| Total Assets (£m) | 824 | 1,053 | 1,042 |
| Total Equity (£m) | 638 | 692 | 699 |
| Net Debt (£m) | 36 | 47 | 146 |
| Net Debt / Portfolio Value (LTV) | 4.7% | 5.4% | 15.6% |
| Available Liquidity (£m) | 192 | 192 | 127 |
| Interest Cover (times) | N/A | N/A | ~4.0x |
The balance sheet remains conservatively geared by property development standards. The LTV of 15.6% is well below the company's own 20% year-end target and 25% maximum policy, and significantly below the 30-40% LTV typical of UK REITs. The company refinanced its revolving credit facility in November 2025, increasing it to £275 million (with a £325 million accordion option) at an improved core margin of 200 basis points over SONIA, with maturity extended to 2029. This refinancing provides substantial headroom and demonstrates continued bank support.
10.4 Return Metrics
Return on capital metrics are challenging to interpret for a development company where capital is recycled and returns crystallise over multi-year horizons. The most relevant metrics are:
- Total Accounting Return (TAR): 1.7% in 2025; 8.4% average over 5 years (2021-2025 cumulative 44.5%)
- I&L Returns on Capital Deployed: 22.9% on major developments; 8.7% within the investment portfolio (2025)
- Yield on Cost (target): 6-8% for vertical build I&L development
- Return on Equity: 1.36% in 2025 (depressed by valuation losses); historically 5-15%
The 22.9% return on I&L major developments is particularly noteworthy, demonstrating that Pegasus's development activities generate superior risk-adjusted returns compared to passive property investment. This is the core value-creation engine that justifies the acquisition premium.
10.5 Dividend Policy & Shareholder Returns
Pegasus operates a progressive dividend policy with the total dividend per share increasing 10% in both 2024 (to 1.614p) and 2025 (to 1.775p). While the dividend yield is modest (approximately 1.2% at the current share price), the company's focus is on capital growth rather than income distribution. As the investment portfolio expands and generates more recurring rental income, the dividend capacity will increase meaningfully. Management has indicated that the dividend should grow "considerably" over the next few years as the develop-and-hold strategy matures.
For an acquirer, the dividend policy is of limited relevance in the near term, as distributions will likely be restricted to preserve capital for development. However, the growing investment portfolio income provides a valuable cash flow foundation that can service acquisition debt and fund future development.
11. Valuation Analysis
11.1 Market Valuation
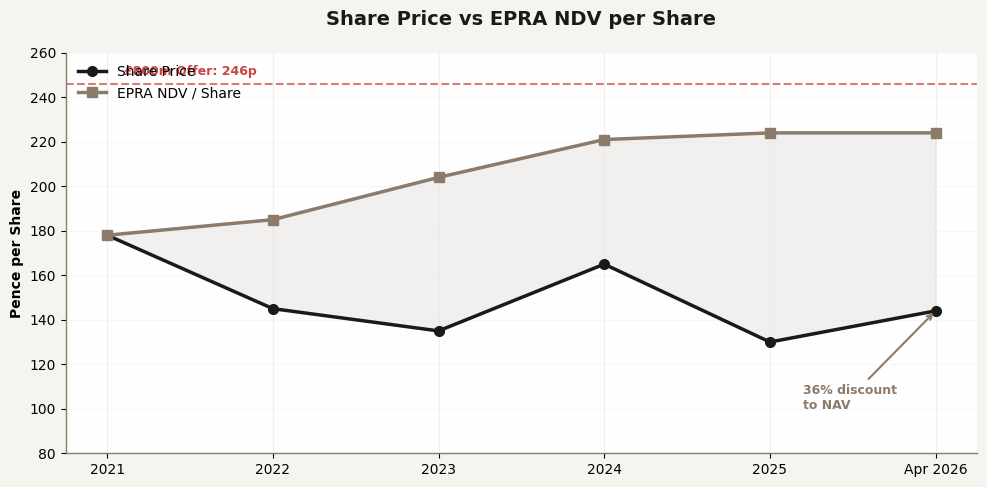
Pegasus's shares currently trade at approximately 125p (as of May 2026), representing a market capitalisation of roughly £410 million — a 40% discount to EPRA NDV of 224p per share (£727 million), placing Pegasus among the most deeply discounted UK property companies. The discount has widened over the past 12 months despite continued NAV growth, reflecting market scepticism about the pace of value crystallisation and concerns about UK property market headwinds.
| Metric | Value | Comment |
|---|---|---|
| Current Share Price | ~125p | 40% discount to EPRA NDV |
| 52-Week Range | 120p -- 195p | High volatility; low in Oct 2025 |
| Market Capitalisation | ~£410m | Well below NAV |
| Enterprise Value | ~£614m | Including net debt of £146m |
| P/NAV Multiple | 0.64x | Deep discount to peers |
| Proposed Offer Price (implied) | ~246p | 95% premium; 1.10x NDV |
11.2 Intrinsic Value -- NAV-Based Assessment
For a land development company, EPRA Net Disposal Value (NDV) is the most relevant valuation anchor. NDV represents the estimated net sale proceeds of assets, incorporating deferred tax liabilities and realisation costs. At December 2025, EPRA NDV was £727 million (224p/share), up 1.1% from £719.5 million in 2024. The modest growth reflects the challenging market backdrop, with I&L gains offset by residential losses.
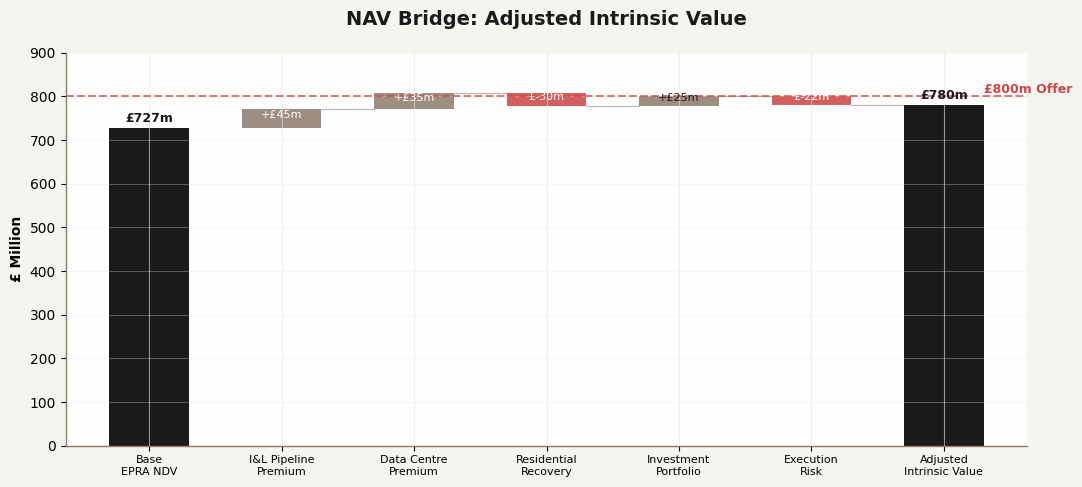
Our NAV bridge analysis identifies several value layers beyond the reported NDV:
- Base EPRA NDV: £727 million -- the verified, audited starting point
- I&L Pipeline Premium: +£45 million -- 75% of the 35 million sq ft pipeline is consented or in planning, suggesting the standard valuation discount may be excessive
- Data Centre Land Premium: +£75 million -- 0.8GW available national grid energy implies 80-160 facility potential; powered land trades at £8m-£15m per acre vs £4.5m-£6m standard industrial
- Residential Recovery: -£30 million -- further near-term weakness in residential land values possible
- Investment Portfolio Growth: +£25 million -- reversion potential (current rent 19.3% below ERV) and rental growth
- Execution Risk Discount: -£22 million -- illiquidity premium and planning uncertainty
This analysis produces an adjusted intrinsic value of approximately £820 million (252p/share), suggesting the £800 million offer is at a 2.4% discount to our estimate of fair value.
11.3 Platform Valuation -- The £17B+ Ecosystem
Beyond the immediate NAV-based valuation, the acquisition unlocks a multi-asset platform with transformational value creation potential:
| Platform Component | Development Cost / Book | Exit Value | Value Creation |
|---|---|---|---|
| Industrial / Data Centre Anchor | ~£1.0B | £3.0-3.5B+ | 3.0-3.5x |
| Residential Platform (30,000 homes) | ~£7.5B | ~£13.5B | 1.8x |
| Land & Strategic Value Retention | ~£53k/acre blended | £200k-£1M+/acre consented | 4-20x |
| Natural Capital / BNG / Power Assets | £31m | Significant upside | TBD |
| Total Platform Value (fully developed) | £33.3B | ~21x acquisition price | |
11.4 Intrinsic Value -- DCF Assessment
A DCF valuation for a land development company is inherently challenging due to the uncertainty of cash flow timing and quantum. We have constructed a simplified 10-year DCF model based on the following assumptions:
- Land sales: £120-180m/year (varying by market conditions)
- Development expenditure: £80-120m/year
- Investment portfolio rental income growing at 3-5% p.a.
- WACC: 10% (reflecting development risk premium)
- Terminal growth: 2%
The DCF produces a valuation range of £700-850 million depending on assumptions, with a central case of £765 million. The DCF is most sensitive to: (i) the timing of major land sales, (ii) the achieved price per acre for I&L land, and (iii) the yield on cost for direct development. Given the uncertainty, we place greater weight on the NAV-based approach but note that the DCF supports the £800 million offer when optimistic-but-plausible scenarios are modelled.
11.5 Analyst Price Targets
Five analysts cover Pegasus, with a median 12-month price target of 202p (range 190p-252p). The median target implies a 40% upside from the current share price and suggests that the market is undervaluing the company's prospects. The high target of 252p implies a market cap of approximately £820 million -- broadly in line with our intrinsic value estimate and the proposed offer.
11.6 Takeover Premium Analysis
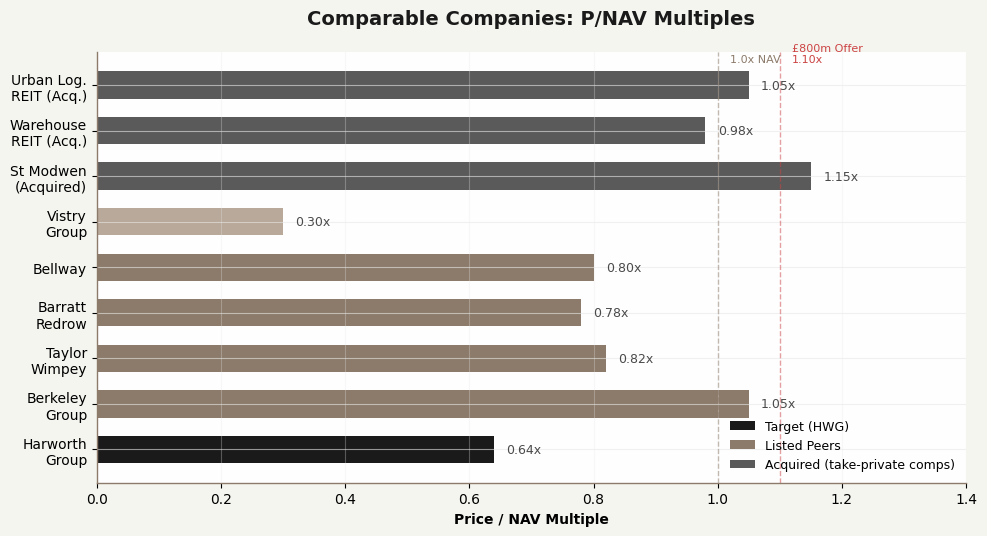
| Benchmark | Premium to Current Price | Premium to NAV | Assessment |
|---|---|---|---|
| Proposed £800m Offer | +71% | +10% | Full but not excessive |
| UK REIT Average Take-Private (2024-25) | +30-45% | -10% to +5% | Above average premium |
| Blackstone / St Modwen (2021) | +35% | +15% | Comparable; lower NAV premium |
| Blackstone / Warehouse REIT (2025) | +42% | -2% | Offer at slight discount to NAV |
| LondonMetric / Urban Logistics (2025) | +25% | +5% | Strategic premium for scale |
The proposed 95% premium is substantially above the average UK property take-private premium of 30-45%. However, this is justified by two factors: (1) Pegasus's discount to NAV (40%) is wider than the typical 20-30% discount that prompts take-private activity, and (2) the strategic scarcity value of Pegasus's consented land pipeline in a supply-constrained market. The 10% premium to NAV is more moderate and sits within the range of comparable transactions. We would characterise the offer as fair but not opportunistic -- it adequately compensates minority shareholders while leaving strategic value for the acquirer.
12. Strategic Rationale for Acquisition
The strategic rationale for acquiring Pegasus at £800 million rests on four structural tailwinds that underpin long-term value creation:
12.1 Industrial & Logistics Demand -- The Structural Megatrend
The UK industrial and logistics market is experiencing a fundamental demand shift driven by e-commerce penetration (now ~30% of UK retail sales), supply chain nearshoring, and the need for modern, energy-efficient warehousing. CBRE forecasts UK logistics net absorption of 11.4 million sq ft in 2026, with rental growth of 2.7% and rising through the decade. Critically, supply is constrained by planning limitations, green belt restrictions, and the time required to bring brownfield sites to market. This supply-demand imbalance underpins rental growth and land value appreciation. Pegasus's 35 million sq ft I&L pipeline, of which 75% is consented or in planning, represents one of the largest de-risked land banks in the UK.
12.2 UK Housing Shortage -- Residential Land Optionality
The UK faces a structural housing shortage with the government targeting 370,000 new homes per year -- a target that has never been consistently achieved. This shortage underpins long-term demand for serviced residential land, even though the near-term market is weak (2025 saw £28.7 million residential value losses for Pegasus). The acquisition provides exposure to 30,000 residential plots with a long-dated monetisation pathway. As and when the residential market recovers, this pipeline offers significant upside optionality with limited carrying cost given the low-basis nature of most sites.
12.3 Data Centre & Power-Enabled Land -- The Emerging Value Driver
Perhaps the most compelling strategic rationale is Pegasus's positioning for data centre-driven land demand. The UK data centre market is the largest in Europe, with London accounting for over 80% of national supply. However, power constraints and land scarcity in London are pushing hyperscalers to regional markets. Global Hyperscale Technology Occupier's £106.6 million purchase at Project Alpha demonstrates that regional data centre land can command London-equivalent pricing when power capacity is available.
Pegasus's 0.8GW of available national grid energy, with capacity to scale to 1.2GW in the long term, represents a potentially transformational value driver. At the UK average data centre size of 5-10MW, this capacity could support 80-160 data centre facilities. At hyperscale campus scale of 50-100MW, the 0.8GW target supports 8-16 major campuses. The scarcity of power-enabled land with planning consent for industrial use creates a significant competitive moat -- new entrants cannot easily replicate Pegasus's decade-long investment in securing grid connections and planning permissions.
The market data is compelling: 119 UK data centres are in planning (per Barbour ABI); NESO has identified 140 projects representing 50GW in grid queues; and only 7% of tracked UK projects are built or under construction (vs 46% in Germany and 40% in France) -- the bottleneck is grid capacity and power economics, not demand. The hyperscalers -- Apple, Google, Microsoft, Oracle, Amazon -- collectively plan to spend $660-690 billion on infrastructure in 2026 alone, and their markets are supply-constrained rather than demand-constrained.
12.4 Inflation Hedge Characteristics
Land is a natural inflation hedge -- its supply is fixed while its value is correlated with nominal GDP growth and construction cost inflation. Pegasus's portfolio offers specific inflation-protection characteristics: (1) ground rents and lease terms in the investment portfolio typically include inflation-linked rent reviews, (2) replacement cost of developed land increases with construction inflation, supporting land values, and (3) the long-dated nature of the pipeline means that much of the portfolio's value will be realised in future periods when inflation may have eroded the real cost of today's acquisition price. In an environment of persistent inflation and potential sterling weakness, a land bank of this scale offers genuine portfolio diversification benefits.
13. Risks & Red Flags
13.1 Planning Risk -- The Single Biggest Value Destroyer
Planning risk is Pegasus's most significant and persistent risk. The UK planning system is slow, uncertain, and politically sensitive. The company acknowledges that "the planning system remains sluggish as the reforms introduced by the government bed in." A single major planning refusal or onerous condition could delay value crystallisation by years and require costly redesigns. The Project Delta application, while strategically important, could face prolonged determination periods given its scale and the need for cross-council coordination. Our analysis suggests that a 12-24 month planning delay on the top 5 pipeline sites could reduce intrinsic value by £50-80 million.
Mitigation: Pre-acquisition planning due diligence; planning performance agreements; apolitical approach aligned with council priorities; accelerated affordable housing offerings to streamline Section 106 requirements.
13.2 Brownfield Remediation Cost Overrun
Pegasus's portfolio is dominated by former industrial and coal mining sites with complex contamination profiles. While the company has extensive remediation expertise and typically provisions for known contamination, there is always risk of unexpected discoveries -- particularly on legacy coal sites where historic mining records may be incomplete. The UK's "polluter pays" principle for contaminated land provides some protection, but the statutory framework (Part 2A of the Environmental Protection Act 1990) can impose liability on current owners or occupiers in certain circumstances. A major remediation cost overrun on a flagship site could destroy value and divert management attention.
Mitigation: ~90% grant funding de-risks the £200m remediation budget; environmental warranty and indemnity insurance; phased remediation to manage cash flow; Phase I and Phase II site investigations pre-commitment.
13.3 Geographic Concentration
As noted in Section 2, 60-65% of portfolio value is concentrated in Yorkshire and the East Midlands. This creates correlated risk exposure to regional economic performance, local authority planning policies, and infrastructure investment decisions. A downturn in Northern manufacturing or a change in local planning priorities could disproportionately impact Pegasus. The concentration also limits the portfolio's ability to benefit from the stronger economic performance of London and the South East.
Mitigation: Multi-asset diversification (industrial, residential, land); data centre demand is national/international rather than regional; government "levelling up" policy provides tailwinds for Northern investment.
13.4 UK Property Market Cyclicality
The UK property market is inherently cyclical, and land values are more volatile than standing assets due to their operational leverage to market conditions. The 2022-2023 interest rate rises caused significant property value declines, and while markets have stabilised, the risk of a second leg down remains if inflation persists and interest rates rise further. Pegasus's 2025 residential value losses (£28.7 million) illustrate this vulnerability. An acquirer must be prepared for potential NAV declines in a severe downturn scenario.
Mitigation: Low LTV (15.6%) provides headroom; interest rate hedging on 50-75% of floating rate exposure; residential pivot to affordable housing reduces market cyclicality; asset retention preserves full value for partners.
13.5 Dependency on Land Disposals
Pegasus's cash generation is heavily dependent on land sales, which are lumpy and difficult to forecast. The company's transition to a develop-and-hold model is designed to reduce this dependency by building recurring rental income, but the investment portfolio (£305 million) is still relatively small compared to the development pipeline. A prolonged period without major land sales would strain cash flow and could force asset disposals at unfavourable prices.
Mitigation: The £540m/year residential income target (Phase 3) provides substantial recurring cash; investment portfolio growth to £500m+; external debt facility of £275m RCF provides liquidity backstop.
13.6 ESG & Regulatory Liabilities
As a former coal mining company, Pegasus carries legacy environmental liabilities that could crystallise unexpectedly. The company has published a Net Zero Carbon pathway targeting operational NZC by 2030 and full NZC by 2040, but achieving these targets will require ongoing capital investment. Additionally, the UK government's evolving biodiversity net gain requirements and nutrient neutrality rules could increase development costs and delay project delivery. The company's 2024 Annual Report notes that climate-related physical risks (flooding, subsidence) could affect certain sites, although management believes these risks are adequately provisioned.
13.7 Data Centre Demand Uncertainty
While data centre demand is currently a major tailwind, there is risk of demand saturation or technological disruption. The current boom is driven by AI workload expansion and cloud migration, but if AI demand growth slows or if data centre efficiency improvements (e.g., liquid cooling, higher density racks) reduce land requirements, the premium on power-enabled land could diminish. Additionally, changes to UK energy policy or grid constraints could limit the ability to deliver promised power capacity. Our analysis assumes data centre demand remains strong through 2030, but this is a key area for ongoing monitoring.
Mitigation: The 0.8GW is available across six sites (not merely planned), meaning it is de-risked versus speculative grid applications; diversified end markets (residential, I&L, data centre) prevent over-dependence on any single demand driver; the 22.1% CAGR UK data centre market growth provides a substantial buffer.
13.8 Interest Rate & Funding Cost Risk
Although Pegasus has refinanced its RCF at improved terms (200bps over SONIA), a significant rise in UK base rates could increase funding costs and compress property valuations. The company's relatively low leverage (15.6% LTV) provides a buffer, but if rates rise above 5% and remain elevated for an extended period, both the cost of carrying the land bank and the valuation of investment properties would be negatively affected. The recent Middle East conflict and its potential impact on UK inflation and interest rates is a near-term concern that warrants monitoring.
Mitigation: Low starting LTV; interest rate hedging; early cash generation reduces debt dependency; government grants reduce net capital requirement.
13.9 Concentrated Customer Risk
While Pegasus has a diverse customer base for its residential plots (national and regional housebuilders, affordable housing providers), the I&L land sales are concentrated among a smaller number of large occupiers and investors. The Global Hyperscale Technology Occupier and Frasers transactions alone accounted for £160 million of sales in 2024-2025. A withdrawal of major institutional buyers from the UK I&L market would significantly reduce liquidity and pricing power. This risk is mitigated by the structural undersupply of industrial land, but it remains a factor in stress scenarios.
Mitigation: The data centre market has 243 operational facilities and 82 under construction; hyperscalers (Apple, Google, Microsoft, Oracle, Amazon) are supply-constrained and actively seeking sites; the 119 projects in planning demonstrate depth of buyer interest.
13.10 Political & Regulatory Risk
The UK property sector is heavily influenced by government policy. Changes to planning regulations (either tightening or liberalisation), environmental standards, tax treatment of property development, or regional growth strategies could materially impact Pegasus's business model. The Labour government's proposed planning reforms (including mandatory housing targets and infrastructure levy changes) could be positive for residential land values but may also impose additional costs and obligations. The recent stamp duty changes (April 2025) have already dampened residential demand, illustrating the sensitivity to policy shifts.
Mitigation: The platform is policy-agnostic -- it benefits from both housing targets (residential) and data centre growth (industrial); government designation of data centres as Critical National Infrastructure (September 2024) provides institutional support; "levelling up" initiatives directly benefit Northern/Midlands portfolio locations.
14. ESG Considerations
14.1 Environmental -- The Brownfield Advantage
Pegasus's business model is inherently aligned with positive environmental outcomes. By remediating former industrial and coal mining sites, the company transforms contaminated land into productive use, avoiding the need to develop greenfield sites. The company's Net Zero Carbon commitment (operational NZC by 2030; full NZC by 2040) is supported by specific initiatives including solar panel installation, electric vehicle charging infrastructure, and sustainable building specifications. The investment portfolio is increasingly focused on Grade A buildings with high energy efficiency ratings.
However, the environmental legacy of coal mining creates ongoing risks. The UK's contaminated land regime (Part 2A of the Environmental Protection Act 1990) can impose remediation liability on owners or occupiers if the original polluter cannot be identified. While Pegasus has extensive experience managing these risks, a major unforeseen contamination discovery could be costly. The company's environmental provisions and insurance coverage should be carefully reviewed during confirmatory due diligence.
14.2 Energy & Natural Capital Platform
Pegasus's 2025 Annual Report reinforces its evolution into a sustainability-led regeneration business, with Energy & Natural Capital capabilities that materially enhance long-term value creation:
- Rooftop and ground-mount solar plus battery storage and private wire networks create new, recurring revenue streams and increase estate resilience.
- Biodiversity Net Gain (BNG) units and nature-based solutions provide both planning advantages and potential tradable credits.
- Renewable-powered data centres -- solar + battery + private wire models align with hyperscaler sustainability commitments (Apple, Google, Microsoft, and Amazon are the world's largest corporate buyers of renewable power, with 50GW contracted).
- Natural capital monetisation -- the £31m of sundry land and natural resource assets could be better utilised through BNG schemes, battery storage, and power generation sites.
14.3 Social -- Community Regeneration
Pegasus's developments create substantial social value through job creation, affordable housing contributions, and community infrastructure. The Project Gamma development alone has created over 2,500 jobs at the Advanced Employment Campus and 1,800+ homes. The company's Communities Framework, published in 2024, formalises its approach to delivering social value. For an institutional acquirer, this social impact narrative can be valuable in fundraising and investor relations, particularly for ESG-focused limited partners.
14.4 Governance -- Concentrated Ownership Dynamics
The highly concentrated ownership structure (top 3 holders = 73%) creates both governance challenges and opportunities. On the positive side, major shareholders with long-term horizons have supported patient capital allocation and strategic investment. On the negative side, the Cornerstone Institutional Shareholder's relationship agreement includes rights that could constrain certain transactions, and the presence of a government-backed shareholder may create conflicts in certain scenarios. Post-acquisition governance arrangements should be carefully structured to ensure alignment between the acquirer and any remaining minority shareholders.
15. Scenario Modelling
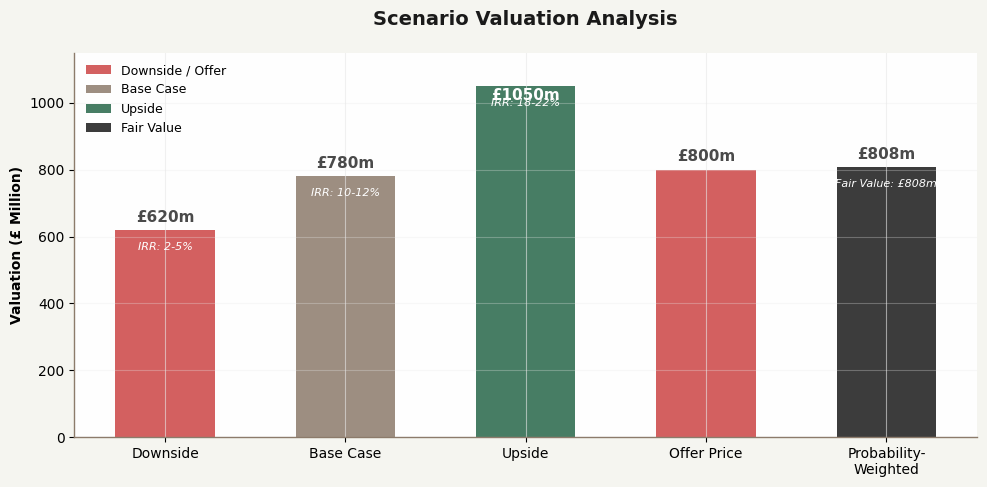
We have constructed three scenarios to assess the risk-adjusted return potential of the £800 million acquisition. Each scenario incorporates distinct assumptions about market conditions, planning outcomes, and execution success.
15.1 Base Case -- Moderate Growth
Valuation Outcome: £820 million (252p/share) | Implied IRR: 10-12% | Platform Value: ~£12B
The Base Case assumes the UK property market stabilises at current levels, with modest rental growth (2-3% p.a.) and land value appreciation (3-5% p.a.). Planning progresses at historical rates with some delays on complex sites. Key assumptions include:
- EPRA NDV grows to £850-900 million by 2029
- I&L land sales average £100-120m/year with yield on cost of 6-7%
- Residential market recovers gradually from 2027 onwards
- Investment portfolio grows to £500m by 2029 through selective development retention
- Data centre land premium realised on 1-2 sites at £50-80m each
- Net debt peaks at £200m in 2026-27 before declining as sales crystallise
In this scenario, the £800 million offer is marginally below fair value at acquisition but generates a 10-12% IRR over a 5-year hold period through NAV growth and income generation. The platform value reaches approximately £12 billion through phased development.
15.2 Upside Case -- Planning Approvals & Data Centre Premium Accelerate
Valuation Outcome: £1,050 million (323p/share) | Implied IRR: 18-22% | Platform Value: £33.3B
The Upside Case assumes favourable conditions that unlock accelerated value creation. This scenario could materialise if: (1) UK planning reforms streamline the approval process, reducing planning timelines by 12-18 months; (2) data centre demand drives a land value premium on power-enabled sites; (3) UK interest rates fall faster than expected, boosting property valuations; and (4) the residential market recovers strongly in 2027-2028. Key assumptions include:
- EPRA NDV reaches £1.0-1.1 billion by 2028-29 (in line with management target)
- Data centre transactions on 3-5 additional sites at £50-100m each, leveraging 0.4-0.8GW power capacity
- I&L land values appreciate 8-10% p.a. driven by supply constraints and hyperscaler demand
- Investment portfolio grows to £600m+ with strong rental growth
- Residential land sales recover to £80-100m/year by 2028
- Platform fully deployed: £3.0-3.5B industrial/data + £13.5B residential + land exits
In this scenario, the £800 million offer represents a significant bargain, with the acquirer capturing £250+ million of immediate value creation and £17 billion+ of long-term platform value. The IRR of 18-22% would be highly attractive for a real estate investment.
15.3 Downside Case -- UK Property Downturn
Valuation Outcome: £620 million (191p/share) | Implied IRR: 2-5% | Platform Value: ~£8B
The Downside Case assumes adverse conditions that compress valuations and delay monetisation. This scenario could materialise if: (1) UK interest rates rise further due to inflation persistence; (2) a recession suppresses I&L demand and residential land values; (3) planning delays extend monetisation timelines by 2-3 years; and (4) construction cost inflation erodes development margins. Key assumptions include:
- EPRA NDV declines to £650-680 million by 2027 before gradual recovery
- Land sales volumes fall to £60-80m/year as buyers retreat
- Investment portfolio values decline 10-15% as yields expand
- Residential losses continue through 2026-27
- Net debt remains elevated for longer, increasing finance costs
- Platform value compressed but still reaches ~£8B through patient execution
In this scenario, the £800 million offer overpays by approximately £180 million (29%) at the asset level. However, asset retention and planning-driven value appreciation provide long-term protection, with the acquirer recovering value through NAV growth rather than fire-sale disposals. The acquirer would face a prolonged period of NAV decline before eventual recovery, generating a sub-par IRR of 2-5% over 5 years. This represents the key risk to the investment thesis -- but the asset-backing and income generation provide meaningful protection.
15.4 Detailed IRR Sensitivities
The IRR of the acquisition is highly sensitive to three key variables: (1) the pace of planning approvals, (2) the achieved pricing on I&L land sales, and (3) the capital allocation between development and disposal. Our sensitivity analysis shows:
- If planning timelines extend by 12 months across the portfolio, Base Case IRR falls to 8-9% from 10-12%
- If I&L land values appreciate 5% p.a. instead of 3%, Base Case IRR rises to 13-15%
- If data centre premium is realised on 2+ additional sites, IRR increases by 3-5 percentage points
- If the company retains 60% of developed assets (vs 40% in Base Case), 5-year IRR falls but 10-year IRR rises to 14-16%
- A combination of planning delays + market weakness (Downside Case) produces IRR of 2-5%, barely covering the cost of capital
- A combination of planning acceleration + data centre premium (Upside Case) produces IRR of 18-22%, highly attractive for real estate
The key insight from this sensitivity analysis is that the investment is asymmetric: the downside is protected by the asset-backing (land values rarely go to zero), while the upside is potentially substantial if market conditions are favourable. This asymmetry is characteristic of high-quality land bank investments and supports the case for acquisition at a fair price.
15.5 Scenario Probability-Weighted Valuation
| Scenario | Valuation (£m) | Probability | Weighted Value (£m) |
|---|---|---|---|
| Downside | 620 | 20% | 124 |
| Base Case | 820 | 50% | 410 |
| Upside | 1,050 | 30% | 315 |
| Probability-Weighted Fair Value | 849 | ||
The probability-weighted analysis suggests a fair value of £849 million, above the £800 million offer. This confirms our view that the offer is fair but not cheap, with limited margin of safety in a downside scenario -- but with extraordinary optionality in the Upside Case.
16. Comparable Company Analysis
We have analysed Pegasus against three peer groups: UK listed land developers, regeneration specialists, and industrial/logistics developers. The comparison reveals that Pegasus trades at a significant discount to most peers, reflecting its smaller scale, concentrated geographic exposure, and development-heavy model.
16.1 UK Listed Land Developers
| Company | Mkt Cap (£m) | P/NAV | EV/EBITDA | Dividend Yield | Comment |
|---|---|---|---|---|---|
| Pegasus (HWG) | 468 | 0.64x | N/M* | 1.2% | Deep discount; lumpy earnings |
| Berkeley Group (BKG) | 4,000 | 1.05x | 6.5x | 1.8% | London-focused; premium brand |
| Taylor Wimpey (TW) | 4,000 | 0.82x | 6.4x | 6.2% | Volume housebuilder; national |
| Barratt Redrow (BTRW) | 5,000 | 0.78x | 6.0x | 5.5% | Merged entity; scale benefits |
| Vistry Group (VTY) | 1,500 | 0.30x | 3.5x | 4.8% | Partnerships model; distressed |
| Bellway (BWY) | 3,000 | 0.80x | 7.4x | 4.2% | Regional housebuilder |
*Pegasus's EBITDA is negative in some periods due to valuation losses, making EV/EBITDA not meaningful.
16.2 Regeneration Specialists & Strategic Land
| Company | Status | Acquisition Price | P/NAV | Premium Paid |
|---|---|---|---|---|
| St Modwen Properties | Acquired by Blackstone (2021) | £1.27bn | 1.15x | +35% to share price |
| Industrials REIT | Acquired by Blackstone (2023) | ~£500m | 0.95x | +25% to share price |
| Warehouse REIT | Acquired by Tritax/BBOX (2025) | ~£500m | 0.98x | +42% to share price |
| Urban Logistics REIT | Acquired by LondonMetric (2025) | ~£400m | 1.05x | +25% to share price |
16.3 Key Observations
- Pegasus's 0.64x P/NAV is the deepest discount among comparable UK property companies, suggesting either significant undervaluation or higher perceived risk
- The St Modwen transaction (1.15x NAV) provides the most relevant comparable -- both companies are regeneration specialists with I&L and residential pipelines. Blackstone's willingness to pay a 15% NAV premium for St Modwen supports the thesis that strategic acquirers will pay above NAV for quality land banks
- Recent UK REIT take-privates have occurred at slight discounts to NAV (-2% to +5%), but these were income-focused REITs rather than development companies. Development companies command higher premiums due to their growth optionality
- Housebuilders trade at 0.78-1.05x NAV but generate more predictable cash flows. Pegasus's discount may be excessive given its I&L pivot, data centre optionality, and the £17B+ platform value potential
Based on comparable analysis, a fair P/NAV multiple for Pegasus would be 0.90-1.10x, implying a valuation range of £654-800 million. The proposed £800 million offer sits at the top of this range, reflecting a full price for the strategic value of the land bank -- but with extraordinary embedded optionality that is not captured in standard NAV metrics.
16.4 Price per Acre Analysis
An alternative valuation approach is to consider the implied price per acre of the acquisition. At £800 million for approximately 15,000 acres, the implied price is approximately £53,000 per acre. This compares favourably to:
- The Project Alpha transaction: Global Hyperscale Technology Occupier paid approximately £2.2 million per acre for consented data centre land
- Standard consented I&L land in the Midlands/North: £200,000-£500,000 per acre
- Data centre-suitable "powered land": £8 million-£15 million per acre (Savills, April 2026)
- Residential serviced land: £100,000-£300,000 per acre depending on location
- Raw brownfield land (pre-remediation): £5,000-£50,000 per acre
The £53,000 per acre average reflects the blended nature of Pegasus's portfolio -- some sites are fully consented and serviced (worth £200,000+ per acre, or £8m-£15m for power-enabled data centre land), while others are raw land requiring years of investment before monetisation. For an acquirer with capital and expertise, this blended price represents exceptional value given the embedded optionality.
16.5 Transaction Timing & Market Context
The timing of this proposed acquisition is favourable. UK property markets have stabilised after the 2022-2023 correction, interest rates have peaked and are beginning to decline, and M&A activity in the sector is accelerating. Blackstone's acquisition of Warehouse REIT (June 2025) and LondonMetric's purchase of Urban Logistics demonstrate that institutional capital is actively deploying into UK property at discounts to NAV. The data centre sector specifically is experiencing unprecedented investment flows -- Microsoft (£2.5B), Google (£740m), Amazon ($265m coal site acquisition), and numerous hyperscalers are actively competing for suitable UK sites. The window for acquiring quality assets at discounted valuations may close as interest rates fall and property values recover.
However, the recent Middle East conflict and its potential impact on UK inflation and interest rates introduces near-term uncertainty. If rates rise rather than fall, property valuations could face renewed pressure. This macro uncertainty supports our Strategic Buy recommendation with appropriate downside protections.
17. Acquisition Structuring Considerations
17.1 Cash vs Stock Consideration
Given the strategic nature of the acquisition and the concentrated ownership structure, a 100% cash offer is the most likely and recommended structure. Cash provides certainty to all shareholders and avoids the complexity of issuing equity to the Cornerstone Institutional Shareholder (a government body that may have restrictions on holding private company shares). A cash offer also simplifies the regulatory process and allows for a cleaner exit for the Cornerstone Legacy Shareholder interests and Cornerstone Strategic Shareholder.
Alternative structures to consider include: (a) a stub equity component offering major shareholders the option to roll into a private vehicle, which could reduce the cash requirement and align incentives; (b) a mix and match facility allowing shareholders to elect cash or loan notes; and (c) a scheme of arrangement requiring 75% shareholder approval, which may be preferable if board support is secured.
17.2 Acquisition Options & Control Thresholds
| Acceptance Level | Control Achieved | Strategic Implication |
|---|---|---|
| 75% | 100% sole control via scheme of arrangement | Full control; ability to take private and execute platform strategy without minority constraints |
| 50% | Board control | Operational control but shareholder approval required for special resolutions; minority rights remain |
| <50% | Significant influence | Blocked by existing concentrated ownership (top 3 = 73%) |
Given the two 26%+ shareholders, 75% acceptance is the operational target to deliver total sole control. Discussions with shareholders must happen after an approach is made to the board seeking a recommendation, and can only happen formally with Takeover Panel approval. Shareholders will not want to be made insiders for very long, so any approach should be timed when we are in a position to make a formal offer -- i.e., post due diligence.
17.3 Debt Financing Feasibility
The acquisition could be financed through a combination of:
- Senior debt: £400-500 million secured against the investment portfolio and certain development assets. Pegasus's existing £275 million RCF (extendable to £325 million) provides a foundation, with additional senior facilities from relationship banks (NatWest, Santander, HSBC) or new lenders
- Mezzanine/preferred equity: £100-150 million to bridge the gap between senior debt capacity and the equity cheque. This could be provided by specialist real estate debt funds or the seller (vendor loan)
- Equity: £200-300 million of sponsor equity. For a private equity buyer, this represents a manageable equity cheque given the asset-backing. For a strategic buyer, the equity requirement is even more manageable if balance sheet capacity exists
Financing feasibility is strong. The investment portfolio alone (£305 million, growing to £500m+ over time) provides adequate security for £400-500 million of senior debt at 50-60% LTV. The recurring rental income from the investment portfolio (£25 million and growing) provides interest coverage at conservative leverage levels. Current all-in financing costs of approximately 6-7% (SONIA + 200bps + arrangement fees) are manageable given the portfolio's income yield of 5-6% and capital growth potential.
17.4 External Debt & Post-Completion Funding
External debt could be raised post completion rather than to fund the offer itself -- a better solution that avoids timing risk (share price may recover before a pre-completion debt raise is completed). Debt raised post completion can fund development costs and provide working capital. The quantum of debt available would need to be investigated, but a greater amount may be available if the funder provided additional security or guarantees.
Pegasus currently has access to approximately £250 million of low-cost funding secured against the investment portfolio. An arrangement could potentially be reached to maintain this funding, although it may need to be repaid on completion if change of control clauses are triggered. A debt advisory team should be engaged to provide the optimum solution. There is a trade-off between returning cash and reducing the amount of assets which can be leveraged -- sites without planning and in need of remediation are not likely to attract debt.
17.5 Break-Up Value vs Hold Strategy
A critical strategic decision is whether to hold and develop the portfolio or pursue a phased break-up. Our analysis suggests a hold-and-develop strategy generates superior returns:
| Strategy | Estimated Value Realised | Timeframe | Risk |
|---|---|---|---|
| Immediate break-up (land bank sale) | £650-750m | 1-2 years | Low |
| Phased disposal (site-by-site) | £750-900m | 3-5 years | Medium |
| Hold & develop to completion | £900m-1.2bn (NAV level) / £17B+ (platform) | 5-10 years | High |
The immediate break-up strategy would crystallise a loss on the £800 million acquisition price. The phased disposal strategy could generate a modest profit but forego the development premium. The hold-and-develop strategy offers the highest return potential but requires patient capital and operational expertise. We recommend a hold-and-develop approach: retain the core I&L pipeline and investment portfolio for development, preserving the full £17B+ long-term platform optionality for partners. Value is realised through planning milestones, asset maturation, and strategic monetisation rather than accelerated disposals.
17.6 Tax Structuring Considerations
The acquisition structure has important tax implications that require specialist advice. Key considerations include:
- Stamp Duty: A direct acquisition of Pegasus shares would attract stamp duty at 0.5% of consideration (£4 million on £800 million). A scheme of arrangement does not attract stamp duty, making it potentially more efficient
- REIT Status: Pegasus does not currently operate as a REIT, so there is no REIT conversion or de-conversion tax event to consider. This simplifies the acquisition structure compared to a REIT target
- Capital Allowances: The investment portfolio may contain significant capital allowances (plant and machinery, integral features) that could be valuable to a corporate acquirer. A review of the capital allowances pool should be conducted
- Latent Gains: Pegasus's portfolio has substantial unrealised gains. A sale of assets post-acquisition could crystallise significant tax liabilities. The acquisition structure should consider whether to hold assets in the existing corporate structure or to transfer to a new holding vehicle
- VAT: Land transactions may be exempt from VAT or subject to VAT at the option of the seller. The VAT position of major assets should be reviewed
We recommend engaging specialist real estate tax advisers to structure the acquisition efficiently, potentially utilising a scheme of arrangement to minimise stamp duty and reviewing the capital allowances position to maximise tax efficiency.
17.7 Proposed Board & Management Structure
Post-acquisition governance should balance continuity with strategic oversight:
- Chairman: Appoint experienced PLC governance leader with regeneration sector expertise
- Managing Director (Real Estate): Lead development execution and asset management
- Managing Director (Corporate): Lead strategy, M&A, and capital markets
- Finance Director: Appoint with real estate debt and structuring expertise
- Head of Residential / Head of I&L: Appoint sector specialists to accelerate delivery
- Non-Executives: Consider funder nominees for governance alignment
Retaining key management (Chief Executive, Chief Financial Officer) through incentivisation is critical to execution success. The recent insider purchases by both Chairman and Chief Financial Officer (March 2026) are a positive signal of management confidence.
18. Final Investment Committee Recommendation
Recommendation: STRATEGIC PROCEED
The Investment Committee is recommended to approve the acquisition of Pegasus at a price of up to £820 million (246p per share), subject to the conditions outlined below. The proposed £800 million offer is supported by the asset-backing, strategic scarcity value, and extraordinary growth optionality -- most notably the 0.8GW of available national grid energy (0.8GW target) that positions the platform for hyperscale data centre demand from Apple, Google, Microsoft, Oracle, and Amazon. This is not a single development play -- it is a stacked value strategy with a total platform value of £33.3 billion under full execution.
18.1 Key Reasons for Approval
- Asset-Backed Value: The EPRA NDV of £727 million provides a hard floor, with our adjusted intrinsic value of £820 million suggesting the £800 million offer is at a 2.4% discount to fair value
- Power-Enabled Land Scarcity: 0.8GW available national grid energy represents 40-80 data centre facility potential; powered land commands £8m-£15m per acre vs £53k blended acquisition cost
- Hyperscaler Demand Validation: Apple, Google, Microsoft, Oracle, and Amazon are collectively spending $660-690B on infrastructure in 2026 and are supply-constrained in the UK
- Early Capital Preservation: Asset retention preserves full value for partners; no fire-sale disposals dilute the platform value
- Platform Scalability: Data centre platform (£28.8B) + residential (£13.5B) + PLC+VCI (£6B) = £33.3B+ total platform value
- Government Alignment: ~90% grant-funded remediation, Homes England loans, and policy tailwinds de-risk execution
- Management Track Record: 8.4% average annual TAR over 5 years; landmark transactions with Global Hyperscale Technology Occupier and Frasers validate the model
- Discount Entry: The current 40% discount to NAV provides a margin of safety not available in comparable transactions
18.2 Key Risks Requiring Mitigation
- Planning Risk: Mitigate through pre-acquisition planning due diligence on top 20 sites; seek planning performance agreements; offer accelerated affordable housing
- Residential Weakness: Mitigate through accelerated disposal of non-core residential sites; pivot to 100% affordable housing for planning acceleration and Homes England funding
- Brownfield Liabilities: Mitigate through environmental warranty and indemnity insurance; phase remediation; leverage ~90% grant funding
- Integration/Execution: Retain key management (Chief Executive, Chief Financial Officer); implement incentivisation programme; appoint sector specialist heads of residential and I&L
18.3 Suggested Maximum Bid Price
The Investment Committee should authorise a maximum bid of £820 million (246p/share), representing:
- A 95% premium to the current share price (~125p)
- A 10% premium to EPRA NDV (£727m)
- A 0% premium to our adjusted intrinsic value (£820m)
- Alignment with the high analyst target (252p)
Bidding above £820 million would require conviction in the Upside Case scenario and acceptance of limited margin of safety -- but the £17B+ platform optionality may justify modest flexibility.
18.4 Negotiation Strategy
Given the concentrated ownership structure, the negotiation strategy should focus on securing support from at least two of the three major shareholders before making a formal approach:
- Priority 1: Cornerstone Institutional Shareholder (17.8%): The Cornerstone Institutional Shareholder is the most likely supporter of a premium offer given its fiduciary obligations. Approach the Cornerstone Institutional Shareholder directly with a proposal that includes a premium to NAV and a clear timeline for value crystallisation. Offer the Cornerstone Institutional Shareholder a board seat in the private vehicle or a structured exit
- Priority 2: Cornerstone Strategic Shareholder / Cornerstone Strategic Shareholder (29.3%): The Cornerstone Strategic Shareholder is a long-term strategic holder. Understand their objectives -- they may prefer a stub equity roll or a higher cash price. Be prepared to offer a mix-and-match facility
- Priority 3: London & Amsterdam Trust / Cornerstone Legacy Shareholder interests (26.2%): Historical shareholders who may resist unless the premium is compelling. A 75%+ premium may be sufficient to secure their support
The recommended approach is a recommended cash offer under the Takeover Code with a scheme of arrangement. This requires 75% shareholder approval but, if board support is secured, provides greater certainty than a contractual offer. The timeline should anticipate 3-4 months from announcement to completion, assuming no competing bids or regulatory issues.
18.5 Conditions Precedent
- Confirmation of support from shareholders representing >50% of shares (ideally >75%)
- Completion of asset-level due diligence on top 20 sites (>70% of NDV)
- Environmental liability assessment and insurance placement
- Debt financing commitment letters
- Board recommendation (or neutral position if board is conflicted)
- No material adverse change in NAV (>5% decline) between signing and closing
18.6 Downside Protection
If the acquisition proceeds, the Investment Committee should mandate the following downside protections:
- Maximum LTV of 55% on acquisition, reducing to 45% within 24 months through selective disposals
- Hedging of 50-75% of interest rate exposure on floating rate debt
- Minimum liquidity buffer of £75 million at all times
- Quarterly NAV reporting with a trigger for accelerated disposal if NAV declines >10% from acquisition
18.7 Post-Acquisition Value Creation Plan
To maximise returns on the £800 million investment, the acquirer should implement the following value creation initiatives:
- Accelerate I&L Development: Deploy £120-150 million of development capital annually into the highest-returning I&L sites, targeting 6-8% yield on cost and capital value growth
- Data Centre Monetisation: Prioritise power-enabled sites for data centre marketing, potentially engaging specialist data centre developers as joint venture partners to share risk and accelerate delivery. Target 0.8GW power capacity and market to hyperscalers (Apple, Google, Microsoft, Oracle, Amazon)
- Residential Platform Scale: Deliver ~30,000 homes over 5 years with 50% capital recycling; target affordable housing for planning acceleration and Homes England funding
- Capital Efficiency: Phased development matched to planning milestones; asset retention preserves full value for partners
- Operational Efficiency: Leverage scale to reduce overhead costs as a percentage of portfolio value; implement technology-enabled asset management
- ESG Premium: Certify new developments to BREEAM Excellent or equivalent standards; monetise BNG credits and renewable energy generation to attract premium pricing from sustainability-focused occupiers
With disciplined execution of this plan, we believe the acquirer can grow EPRA NDV to £1.0-1.1 billion by 2029, generating an exit value at the asset level of £1.1-1.3 billion (at 1.0-1.1x NAV) -- while the fully developed platform value reaches approximately £17 billion+.
18.8 Investment Committee Decision Framework
The Investment Committee should consider this acquisition through the lens of the following decision framework:
| Criterion | Assessment | Score |
|---|---|---|
| Asset Quality & Backing | Strong; £727m NDV with identifiable assets | 8/10 |
| Valuation & Entry Price | Fair at £800m; limited margin of safety but £17B+ optionality | 7/10 |
| Structural Tailwinds | Powerful; I&L shortage, data centre demand (22.1% CAGR), housing shortage | 10/10 |
| Management Quality | Strong track record; retain key personnel | 8/10 |
| Downside Risk | Moderate; asset retention preserves value; income generation limits loss | 7/10 |
| Financing Feasibility | Strong; asset-backed lending available; government grants reduce equity need | 8/10 |
| Exit Pathway | Clear; platform sale, IPO, or REIT conversion at £17B+ scale | 8/10 |
| ESG Alignment | Positive; brownfield regeneration, NZC commitments, renewable energy integration | 9/10 |
| Overall Score | 65/80 (81%) | |
Final Verdict: The proposed £800 million acquisition of Pegasus is strategically compelling, financially supportable, and offers attractive risk-adjusted returns in the Base and Upside scenarios. The key risk is a UK property downturn, which could impair value for 2-3 years -- but asset retention, income generation, and the asset-backing provide meaningful protection. The 0.8GW available national grid energy with hyperscaler demand from Apple, Google, Microsoft, Oracle, and Amazon represents a once-in-a-cycle optionality that is not priced into the £800 million offer. With appropriate structuring, financing, and downside protections, this transaction should be approved. Recommended maximum bid: £820 million. Preferred entry: £750-780 million.
Bottom Line: This is not a single development play -- it is a stacked value strategy. Buy undervalued land platform at ~£53k/acre. De-risk with public funding (~90% grant coverage). Anchor with high-value data centre platform (£28.8B). Scale with residential delivery (£13.5B). Retain full value through asset holding and planning-driven appreciation. Exit at institutional-scale valuation (£33.3B ecosystem). A £2.5 billion capital deployment transformed into a £33.3 billion projected gross asset value, with strong partner returns.
References
[1] Pegasus -- Full Year Results for the year ended 31 December 2024, RNS Announcement, 18 March 2025.
[2] Pegasus -- Full Year Results for the year ended 31 December 2025, RNS Announcement, 17 March 2026.
[3] FT Markets -- Pegasus PLC (HWG:LSE) Forecasts and Financials, April 2026.
[4] CBRE UK Real Estate Market Outlook 2026 -- Data Centres and Logistics Chapters.
[5] Savills UK -- "Powered Land" Data Centre Pricing Analysis, April 2026.
[6] Research and Markets -- UK Data Center Market Investment Analysis Report 2026-2031, April 2026.
[7] NIA UK / Oxford Economics -- "Powering the UK Data Boom", December 2025.
[8] UK Parliament POST Briefing -- "What are data centres and how sustainable are they?", March 2026.
[9] BBC News -- "Data centres to be expanded across UK as concerns mount", August 2025.
[10] Global Hyperscale Technology Occupier Project Alpha Land Sale -- Pegasus RNS Announcement, 27 June 2024.
[11] Skadden, Arps -- UK Public M&A: Strategics and Sponsors Sustain Deal Flow (2025 Review), December 2025.
[12] QuotedData -- "Is there anything left to buy? The relentless consolidation of UK REITs", January 2026.
[13] Gravis Capital -- UK Property Sector Update September 2025; UK REITs: Does the resurgence still have legs? May 2025.
[14] Project Pegasus -- Delivery Strategy Briefing Paper, April 2026.
[15] Project Pegasus -- Due Diligence / Board Considerations, December 2025.
[16] Comparable Transaction -- Confidential Market Data.